Treepz Super App: Unifying Fragmented Mobility Solutions
TL;DR
As a Senior Product Designer, I identified critical UX fragmentation across Treepz's mobility services. My research and strategic recommendations earned me a promotion to Product Design Lead, where I guided our team (2 designers, 1 UX writer) to create a unified super-app starting with our two core services: Business Treepz (B2B employee transportation) and Car Rental. Together, we delivered this transformation in a 3-month design and development cycle.
| Impact We Achieved (Phase 1) | Before (Q1 2024) | After (Q3 2024) | Change |
|---|---|---|---|
| B2B clients across 4 countries | 5 companies | 15 companies | +200% |
| Monthly employee commutes | 8K | 94K | +1075% |
| Engineering effort per new feature | Baseline | -28% (shared design system) |
"Finally, one app for our employee transportation and event rentals. Our HR team loves the unified admin dashboard."
Corporate client, Lagos
The Problem
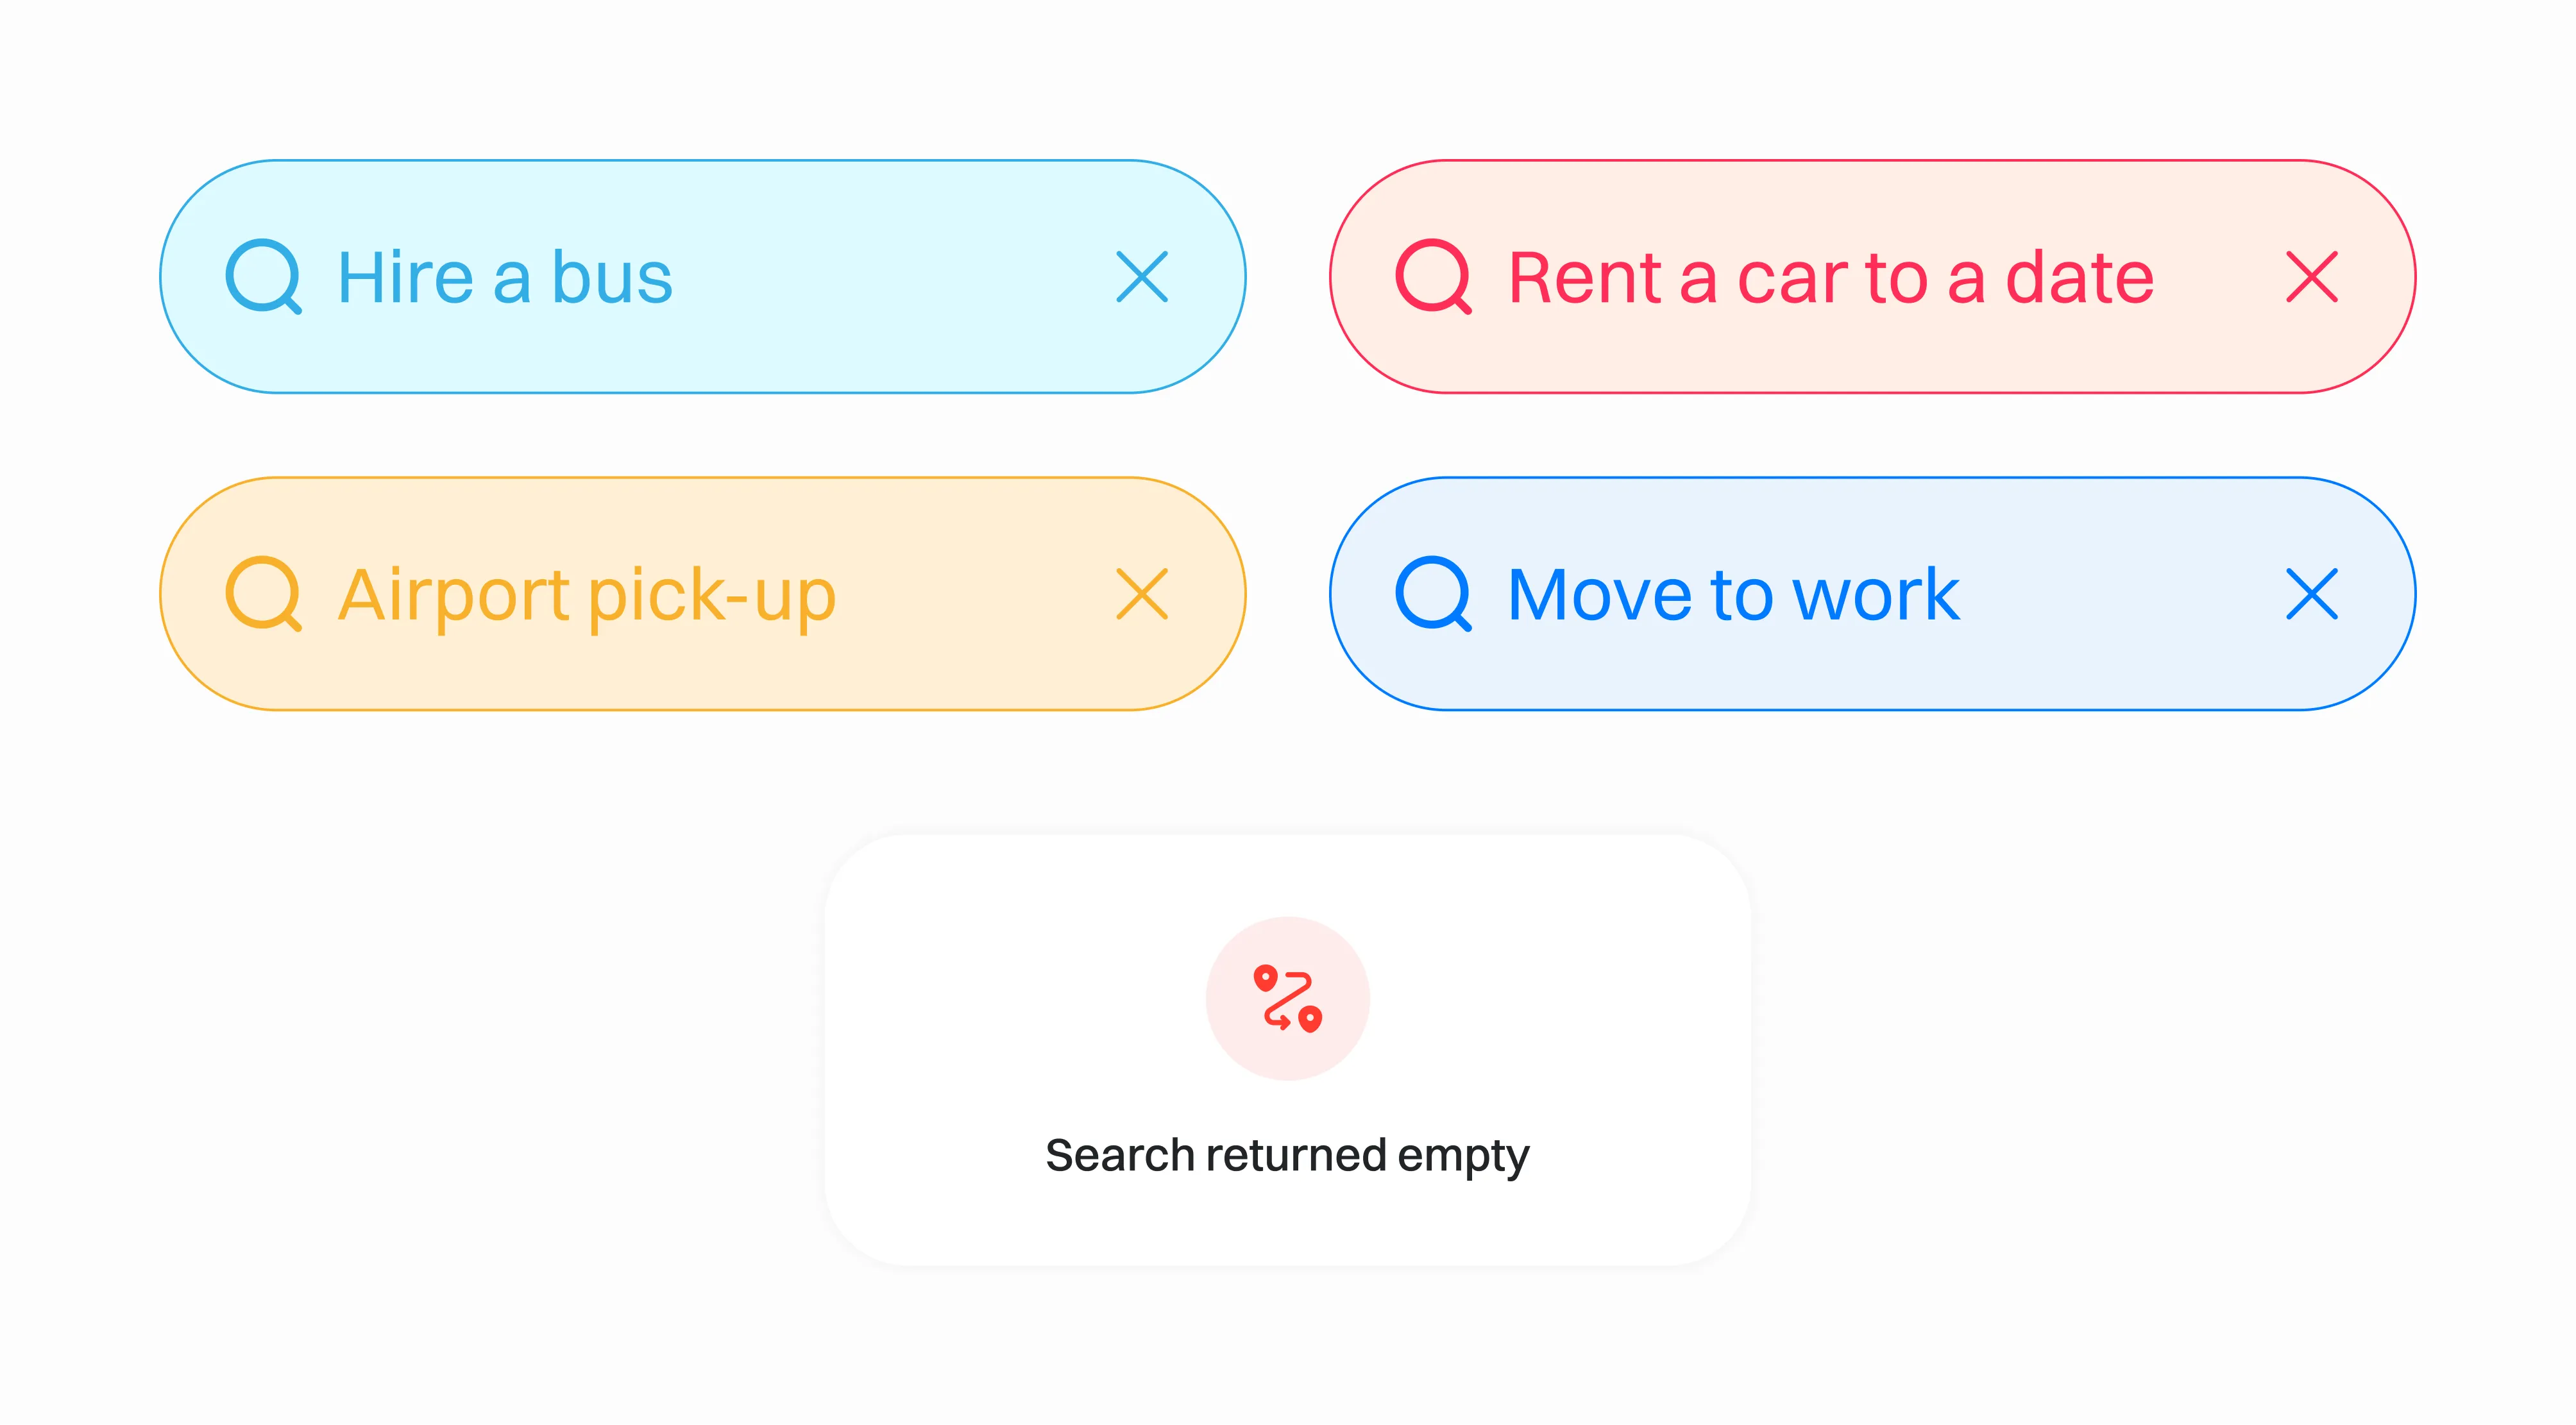
A year after joining Treepz as a Product Designer, I discovered a critical problem across West and East Africa's mobility ecosystem. Commuters, corporate clients, event organizers, and travelers were juggling multiple fragmented platforms for their transportation needs: daily work commutes, employee transportation management, special event vehicle rentals, and airport transfers.
Through user interviews and data analysis, we found that 67% of our corporate clients were using 2-3 different transportation apps for their various needs. Event organizers spent an average of 45 minutes comparing services across platforms before making booking decisions. This fragmentation was costing us potential revenue and frustrating our users. I shared my findings with my line manager, and we agreed this presented a massive opportunity to create a unified mobility super-app covering all four transportation needs.
How We Conducted Research
Defining Our Audience
We analyzed data from Nigeria, Ghana, Uganda, and Kenya to identify four mobile-first groups: Daily Commuters, B2B Decision Makers, Event Organizers, and Airport Travelers. Each group had distinct priorities like reliability, cost control, service variety, and real-time tracking. All these segments rely on smartphones for payments and logistics, guiding our targeted design approach.
Our research revealed that 78% of business transportation decisions are made by HR managers and office administrators, while 65% of event transportation bookings come from individuals planning personal celebrations like weddings and family gatherings.
Data sources: Internal Treepz user analytics (Q4 2023), GSMA Mobile Economy Africa 2023 report, and local transportation surveys conducted in Lagos, Accra, Kampala, and Nairobi (n=50 respondents each city)
Our Research Strategy
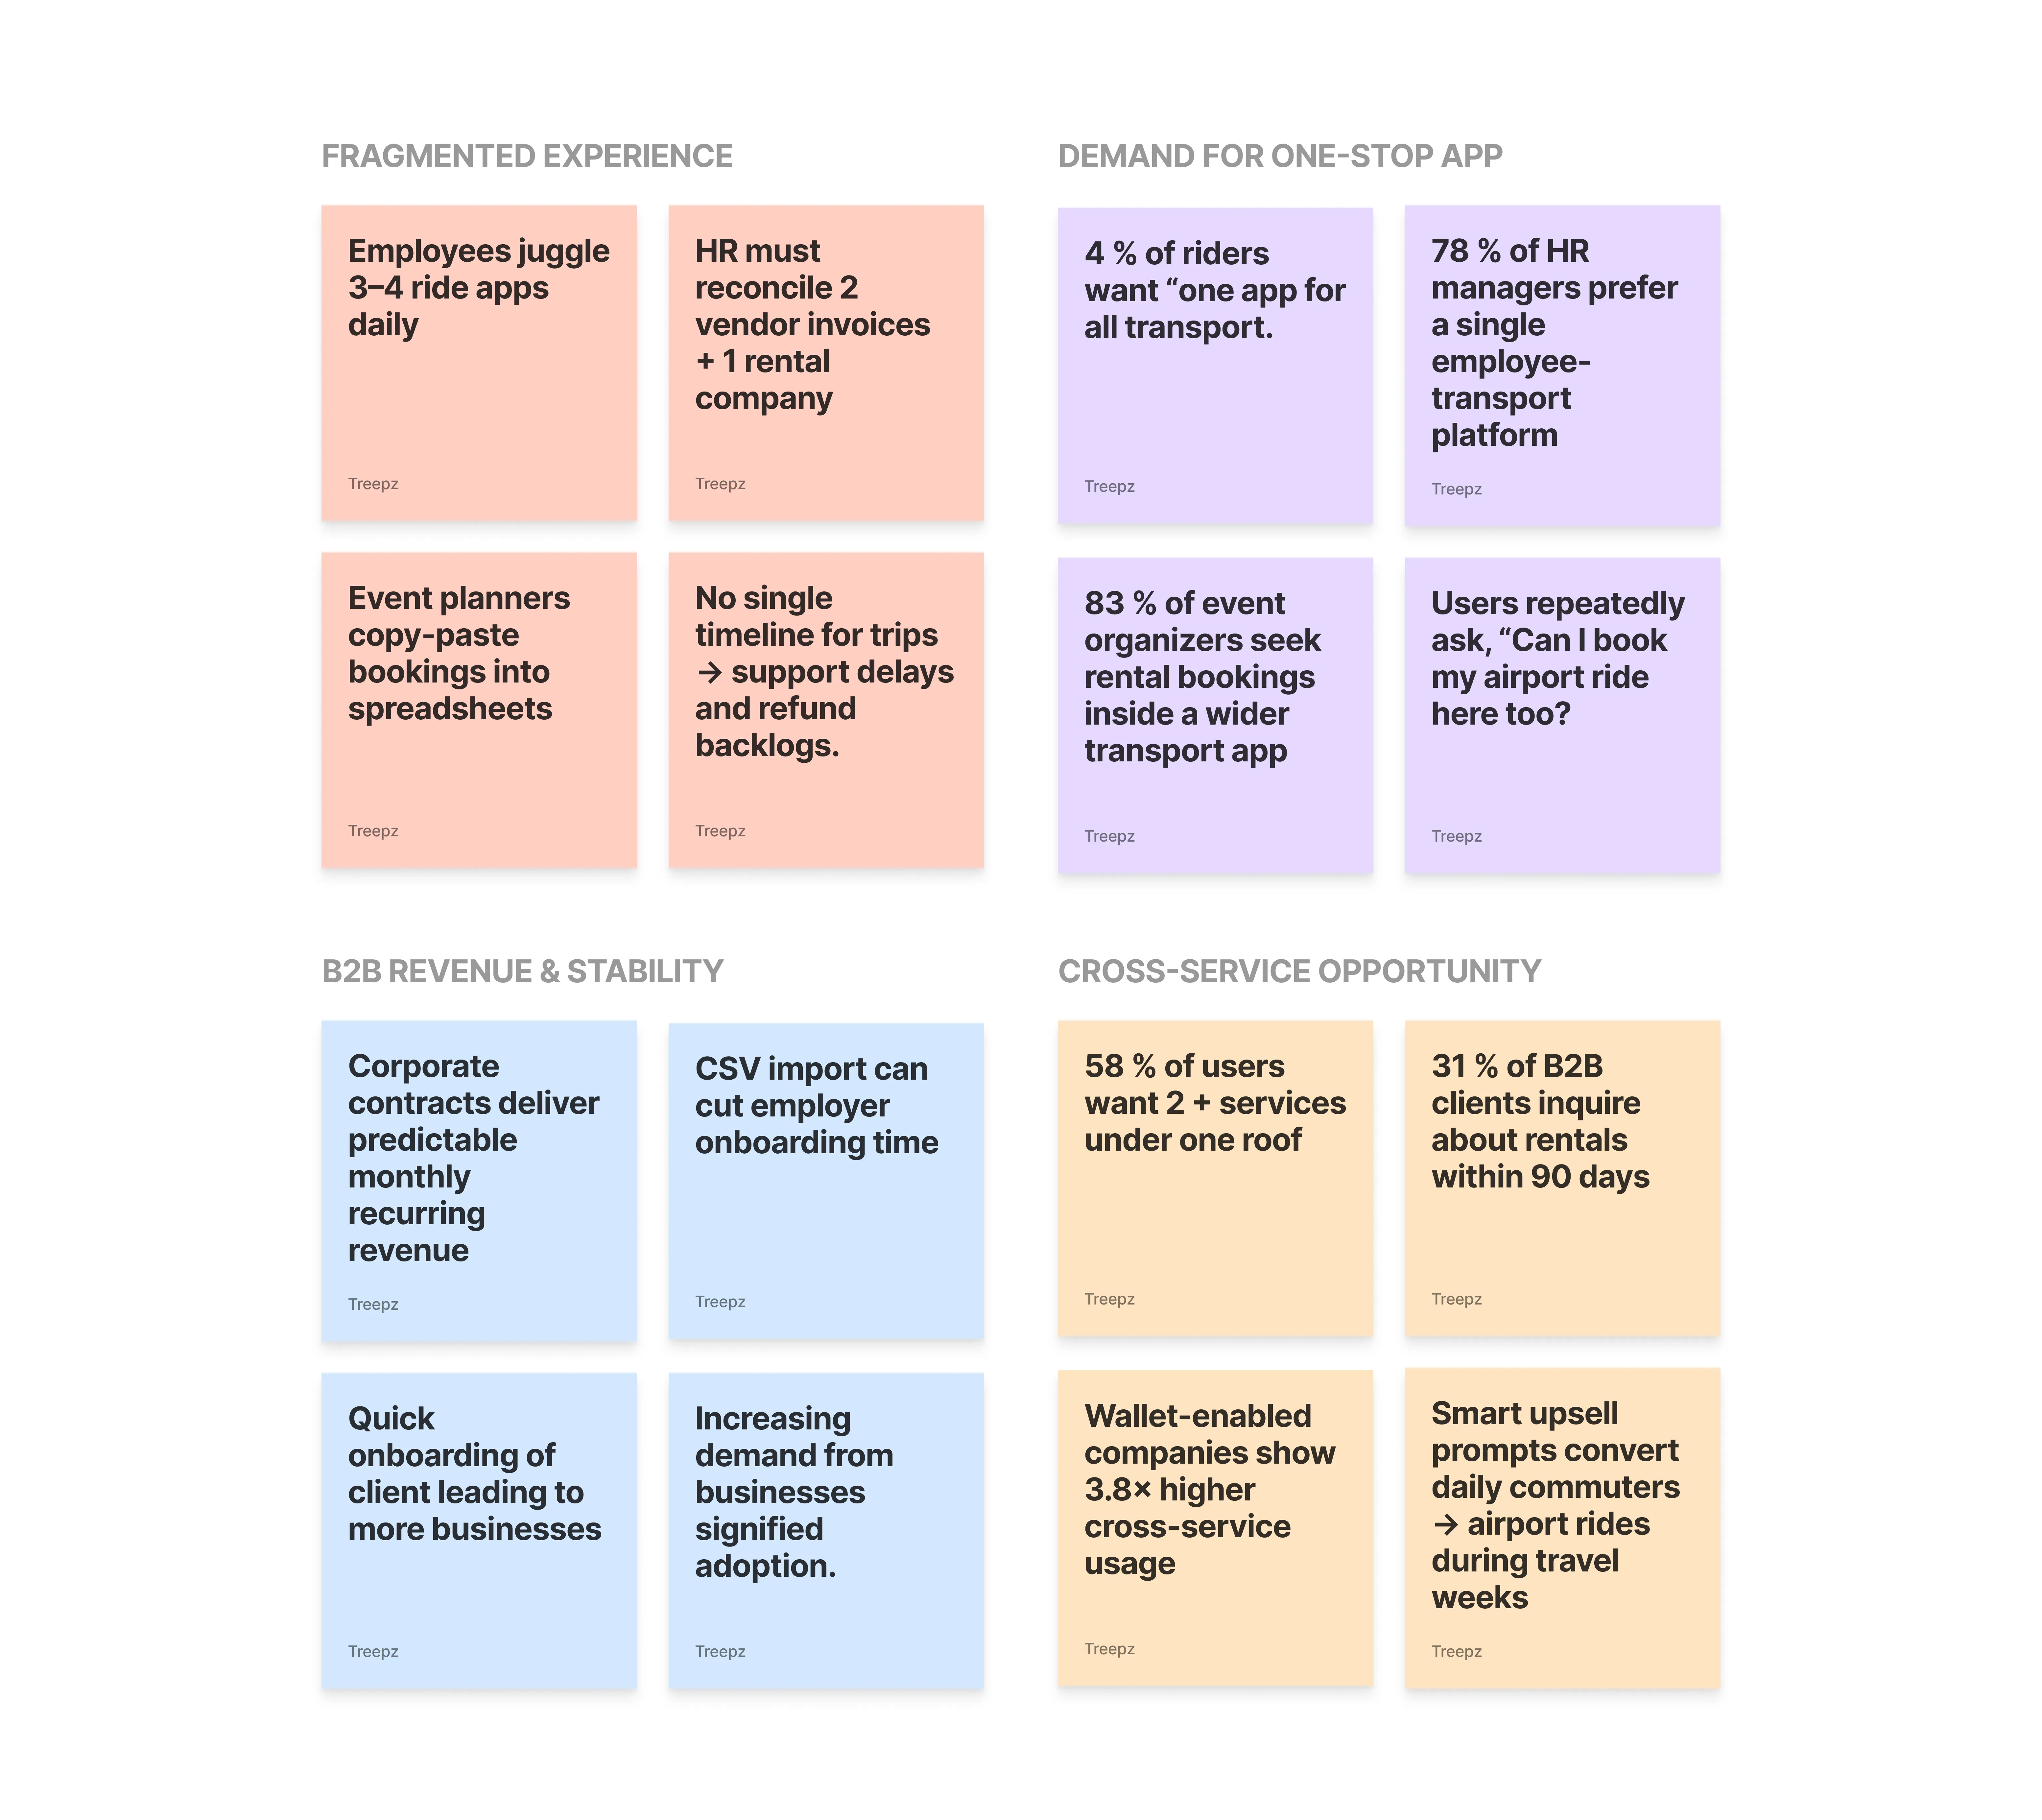
Using FigJam for collaborative affinity mapping, our entire team, including the PM, synthesized survey, interview, and analytics findings to reveal critical trends across all mobility segments.
Key insights from our research:
- 73% of HR managers wanted a single dashboard for all employee transportation
- Event organizers spent 2.5x longer on bookings due to platform switching
- 68% of users preferred wallet-based payments over per-ride transactions
- Cross-selling opportunities existed in 84% of our B2B client base
Research methodology: 15 stakeholder interviews per market (60 total), online surveys with 50 respondents across four countries, and analysis of 12 months of user behavior data from existing Treepz services
Solution and Opportunity
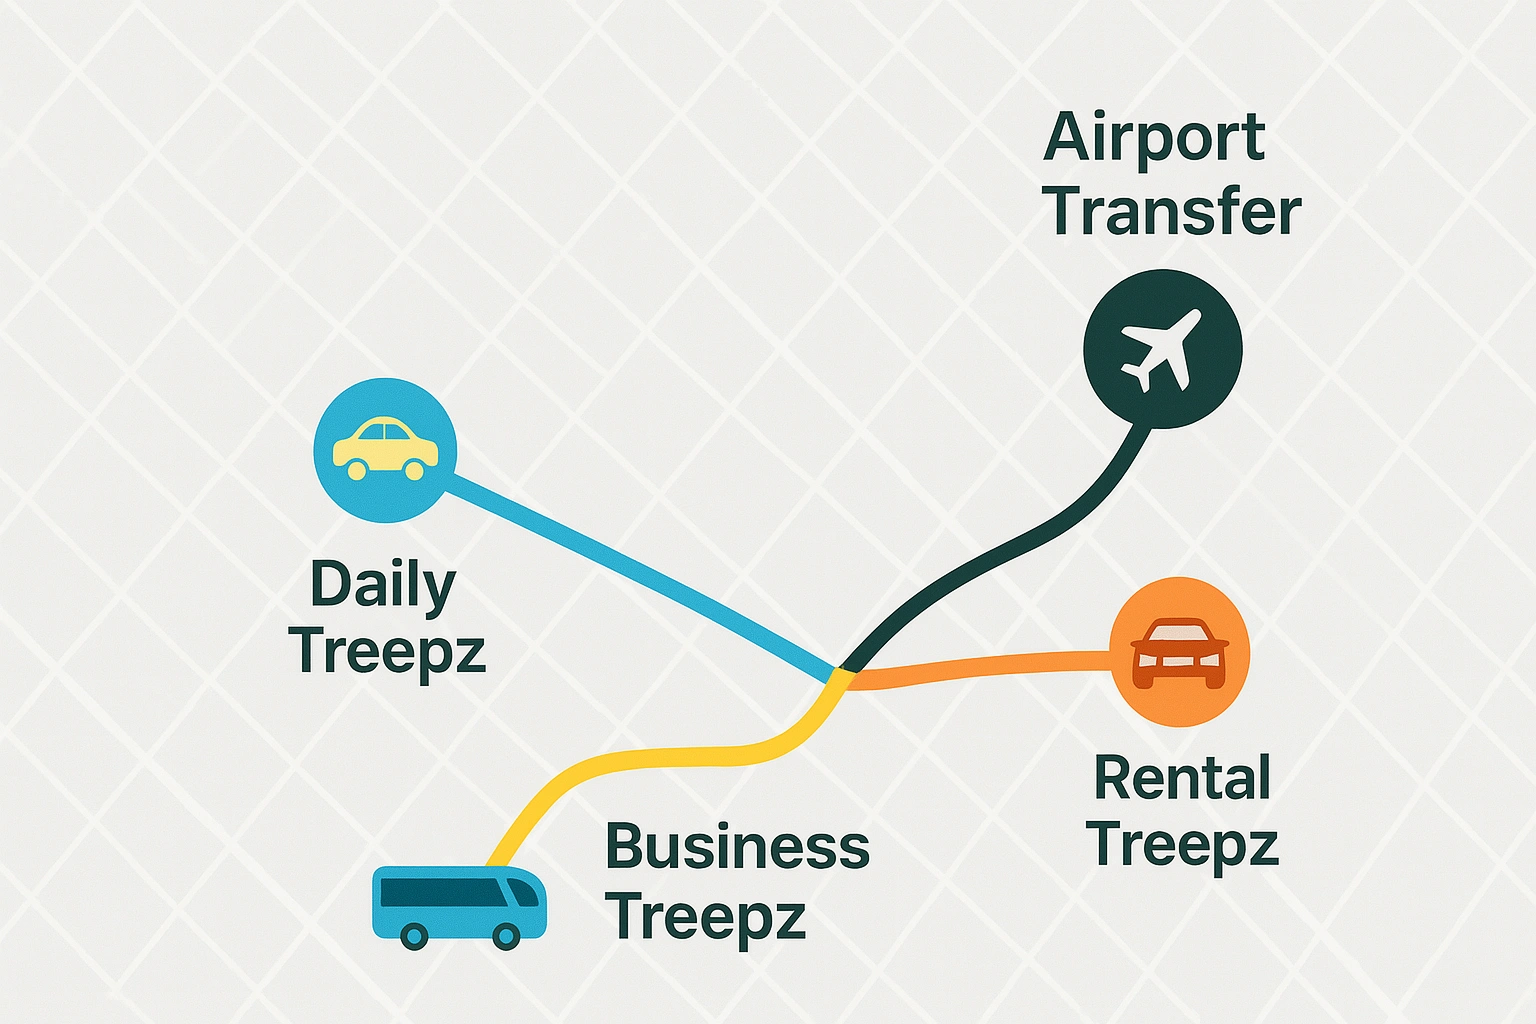
Our team's vision was a comprehensive four-service mobility super-app covering Daily commutes, Business employee transport, Car rentals, and Airport transfers. However, for Phase 1, we focused on implementing Business Treepz (B2B employee transportation) and Car Rental (event-based vehicle hire), with the full super-app architecture designed to seamlessly accommodate the remaining services.
To bring this to life, we held several brainstorming workshops. I facilitated these sessions with our design team and PM using FigJam to map out user flows and initial concepts. The Phase 1 goal was to design a system where:
- Employees could check in and out for work commutes seamlessly via mobile app
- HR teams could monitor employee transportation via Business Admin dashboard
- Event organizers could browse, book, and pay for rental vehicles in one flow
- Our ops team could manage B2B contracts, rental fleet, and prepare for Airport/Daily services from the comprehensive Treepz Admin
This foundation would validate our super-app architecture while preparing us for Q2 2025 expansion to Airport transfers and Daily commutes, creating a comprehensive mobility solution across Nigeria, Ghana, Uganda, and Kenya.
The Jobs To Be Done Framework We Established
In a workshop with our PM and the full design team, we synthesized our research into four core JTBD statements covering all transportation verticals. These became the north star that guided every design and product decision we made:
"When I need to get to work every morning, I want reliable transport with predictable timing and pricing so I can arrive punctually without the stress of multiple booking attempts."
The Daily Commuter
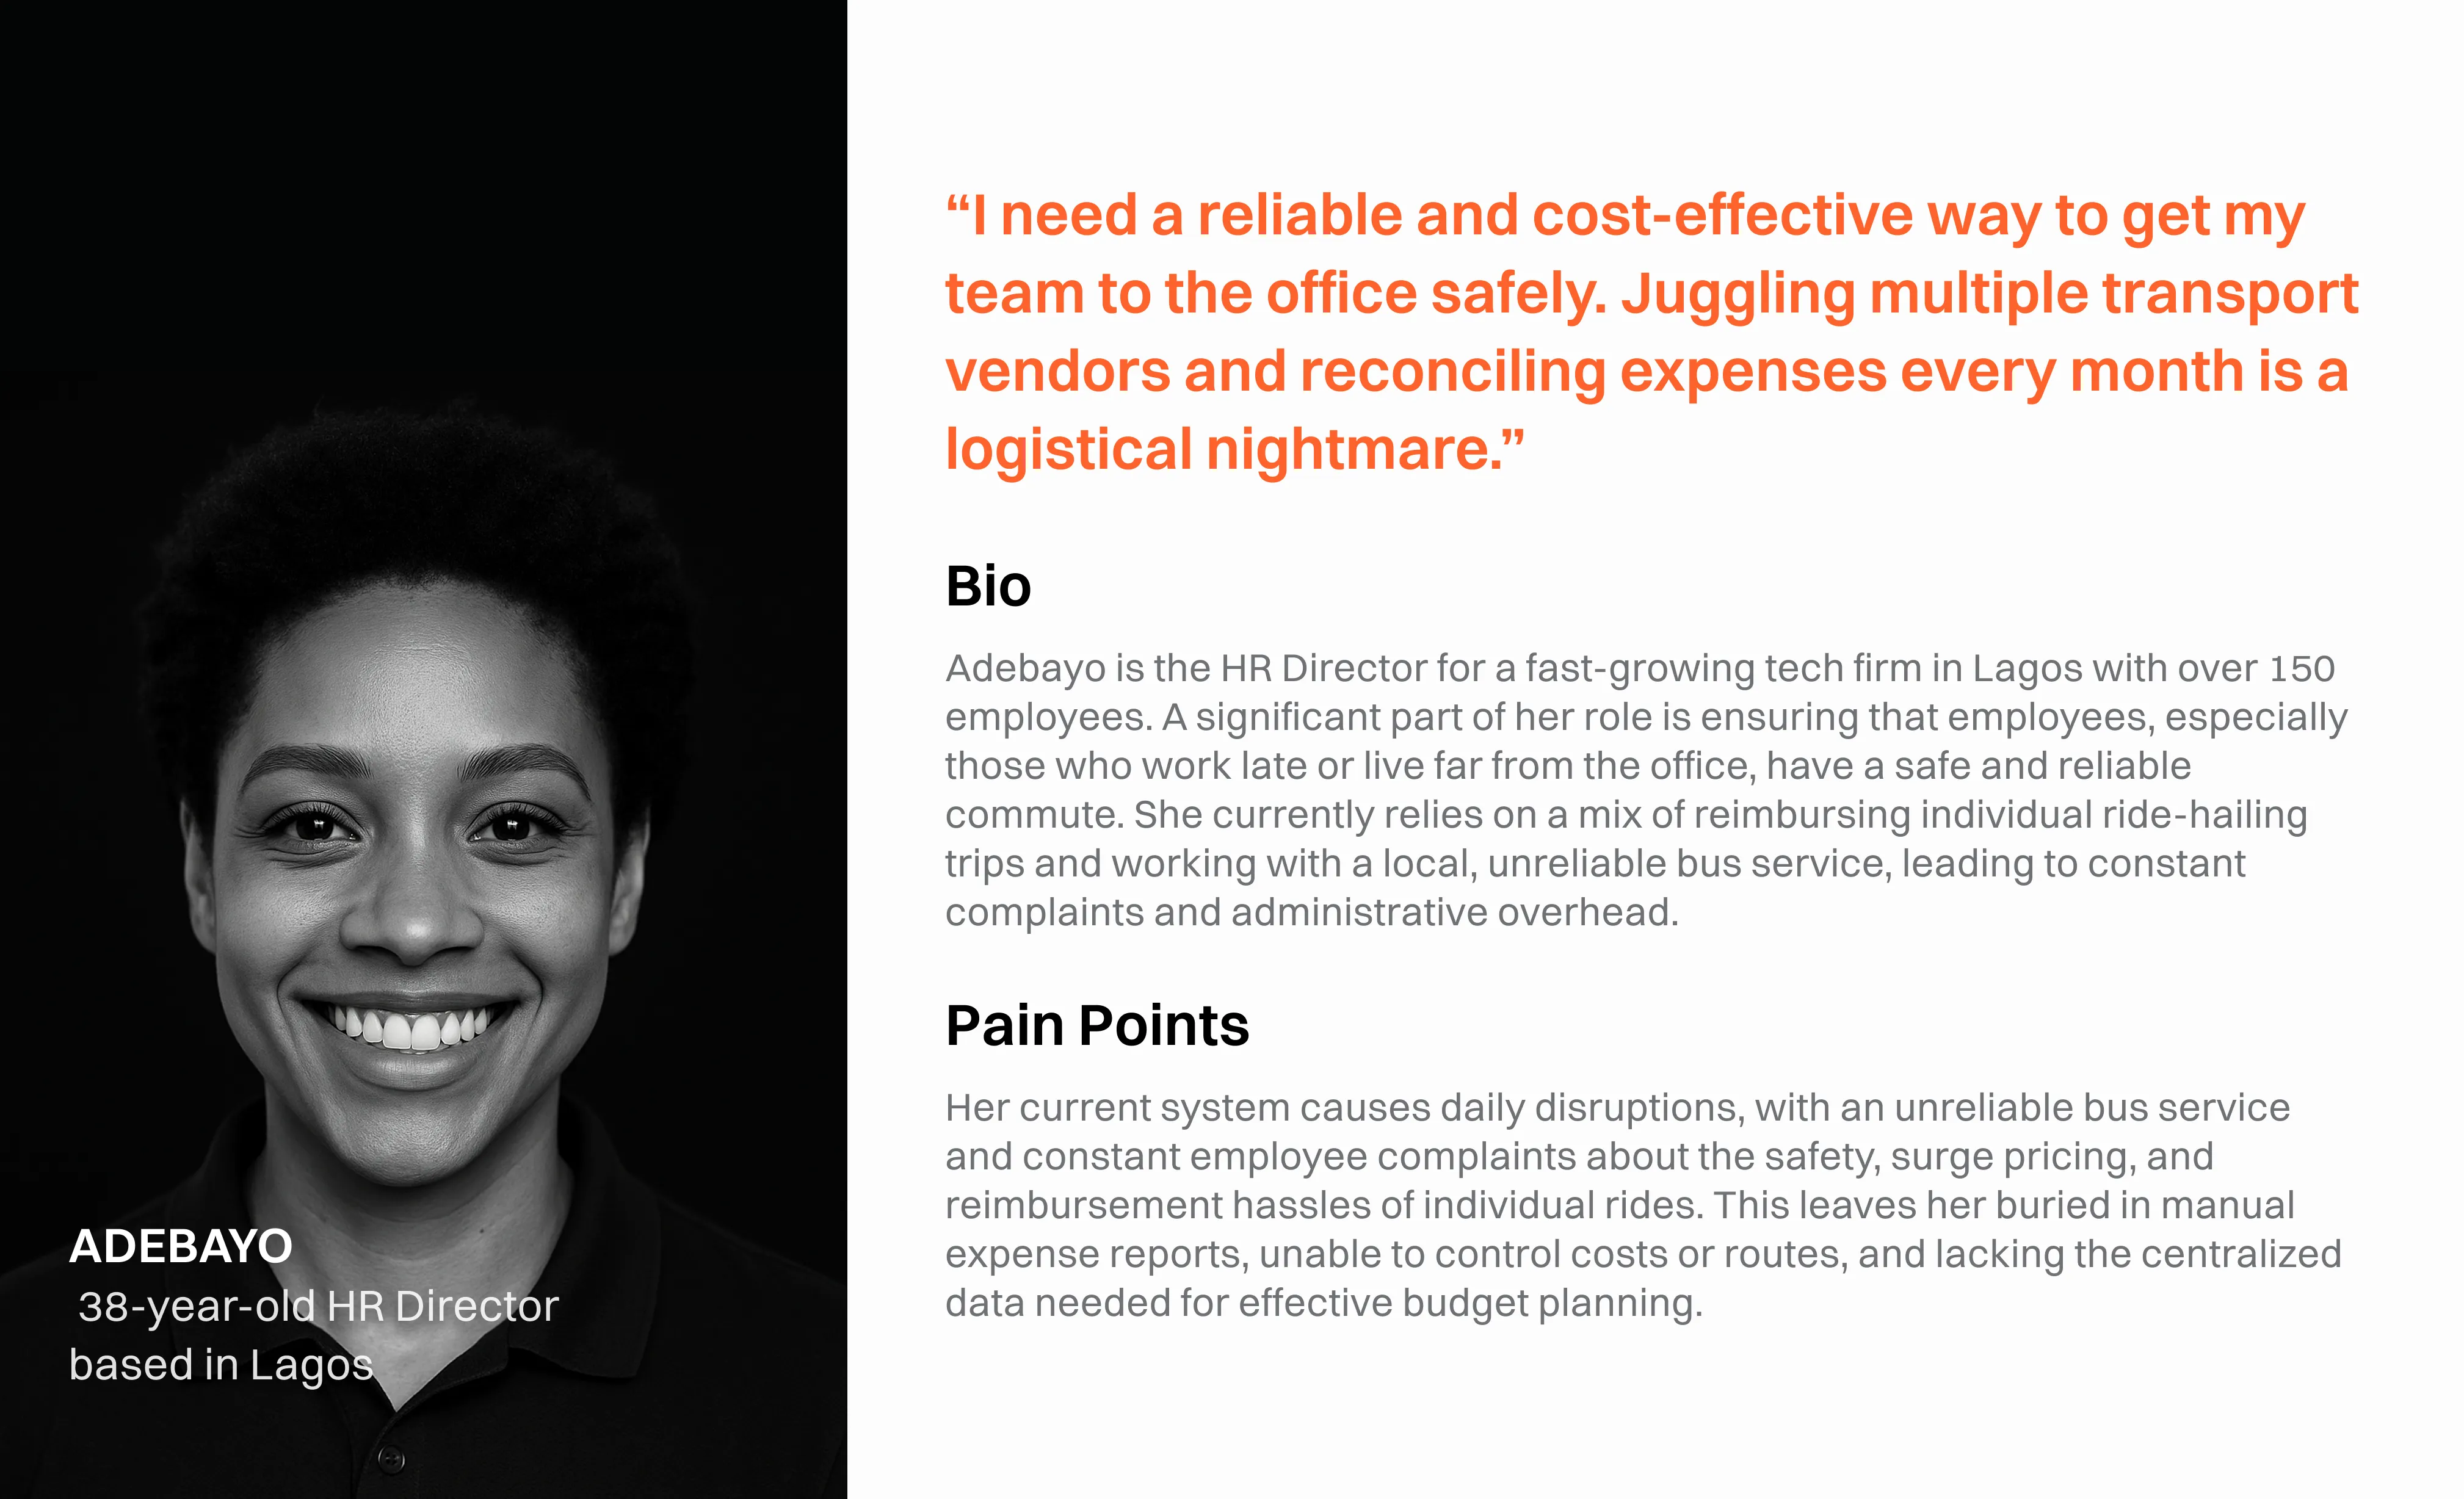
"When I need to set up employee transportation for our growing company, I want one platform to onboard staff, track commutes, and manage costs so I can ensure reliable service without juggling multiple vendors."
The HR Manager
"When I'm planning my daughter's wedding, I want to browse, compare, and book different vehicle types for guest transport and couple arrival so I can coordinate everything seamlessly in one place."
The Event Organizer
"When I have a flight to catch, I want guaranteed pickup and drop-off with real-time tracking and driver coordination so I never miss a flight due to transportation delays."
The Airport Traveler
Designing the Platform Architecture
As a team, we architected Treepz as a multi-sided B2B/B2C platform with four interconnected products sharing one design language and backend. I led the overall information architecture, while the other designers focused on specific user-facing applications.
The architecture needed to handle different user types (employees, event organizers, HR managers, drivers) while maintaining data consistency and enabling cross-service functionality like shared wallets and unified trip histories.
Our team created a token-based design system in Figma, which I had the privilege of naming the Wheels Design System. It is a scalable, token-based framework where I defined the token architecture, one designer developed core components, and our UX writer set the voice and tone guidelines, resulting in a native cross-platform experience that reduced engineering cycles by 28%.
Building the Core Experience
One of our product designers and I paired on the Mobile App. We ran weekly design critiques to refine the core flows, focusing on:
1. Onboarding
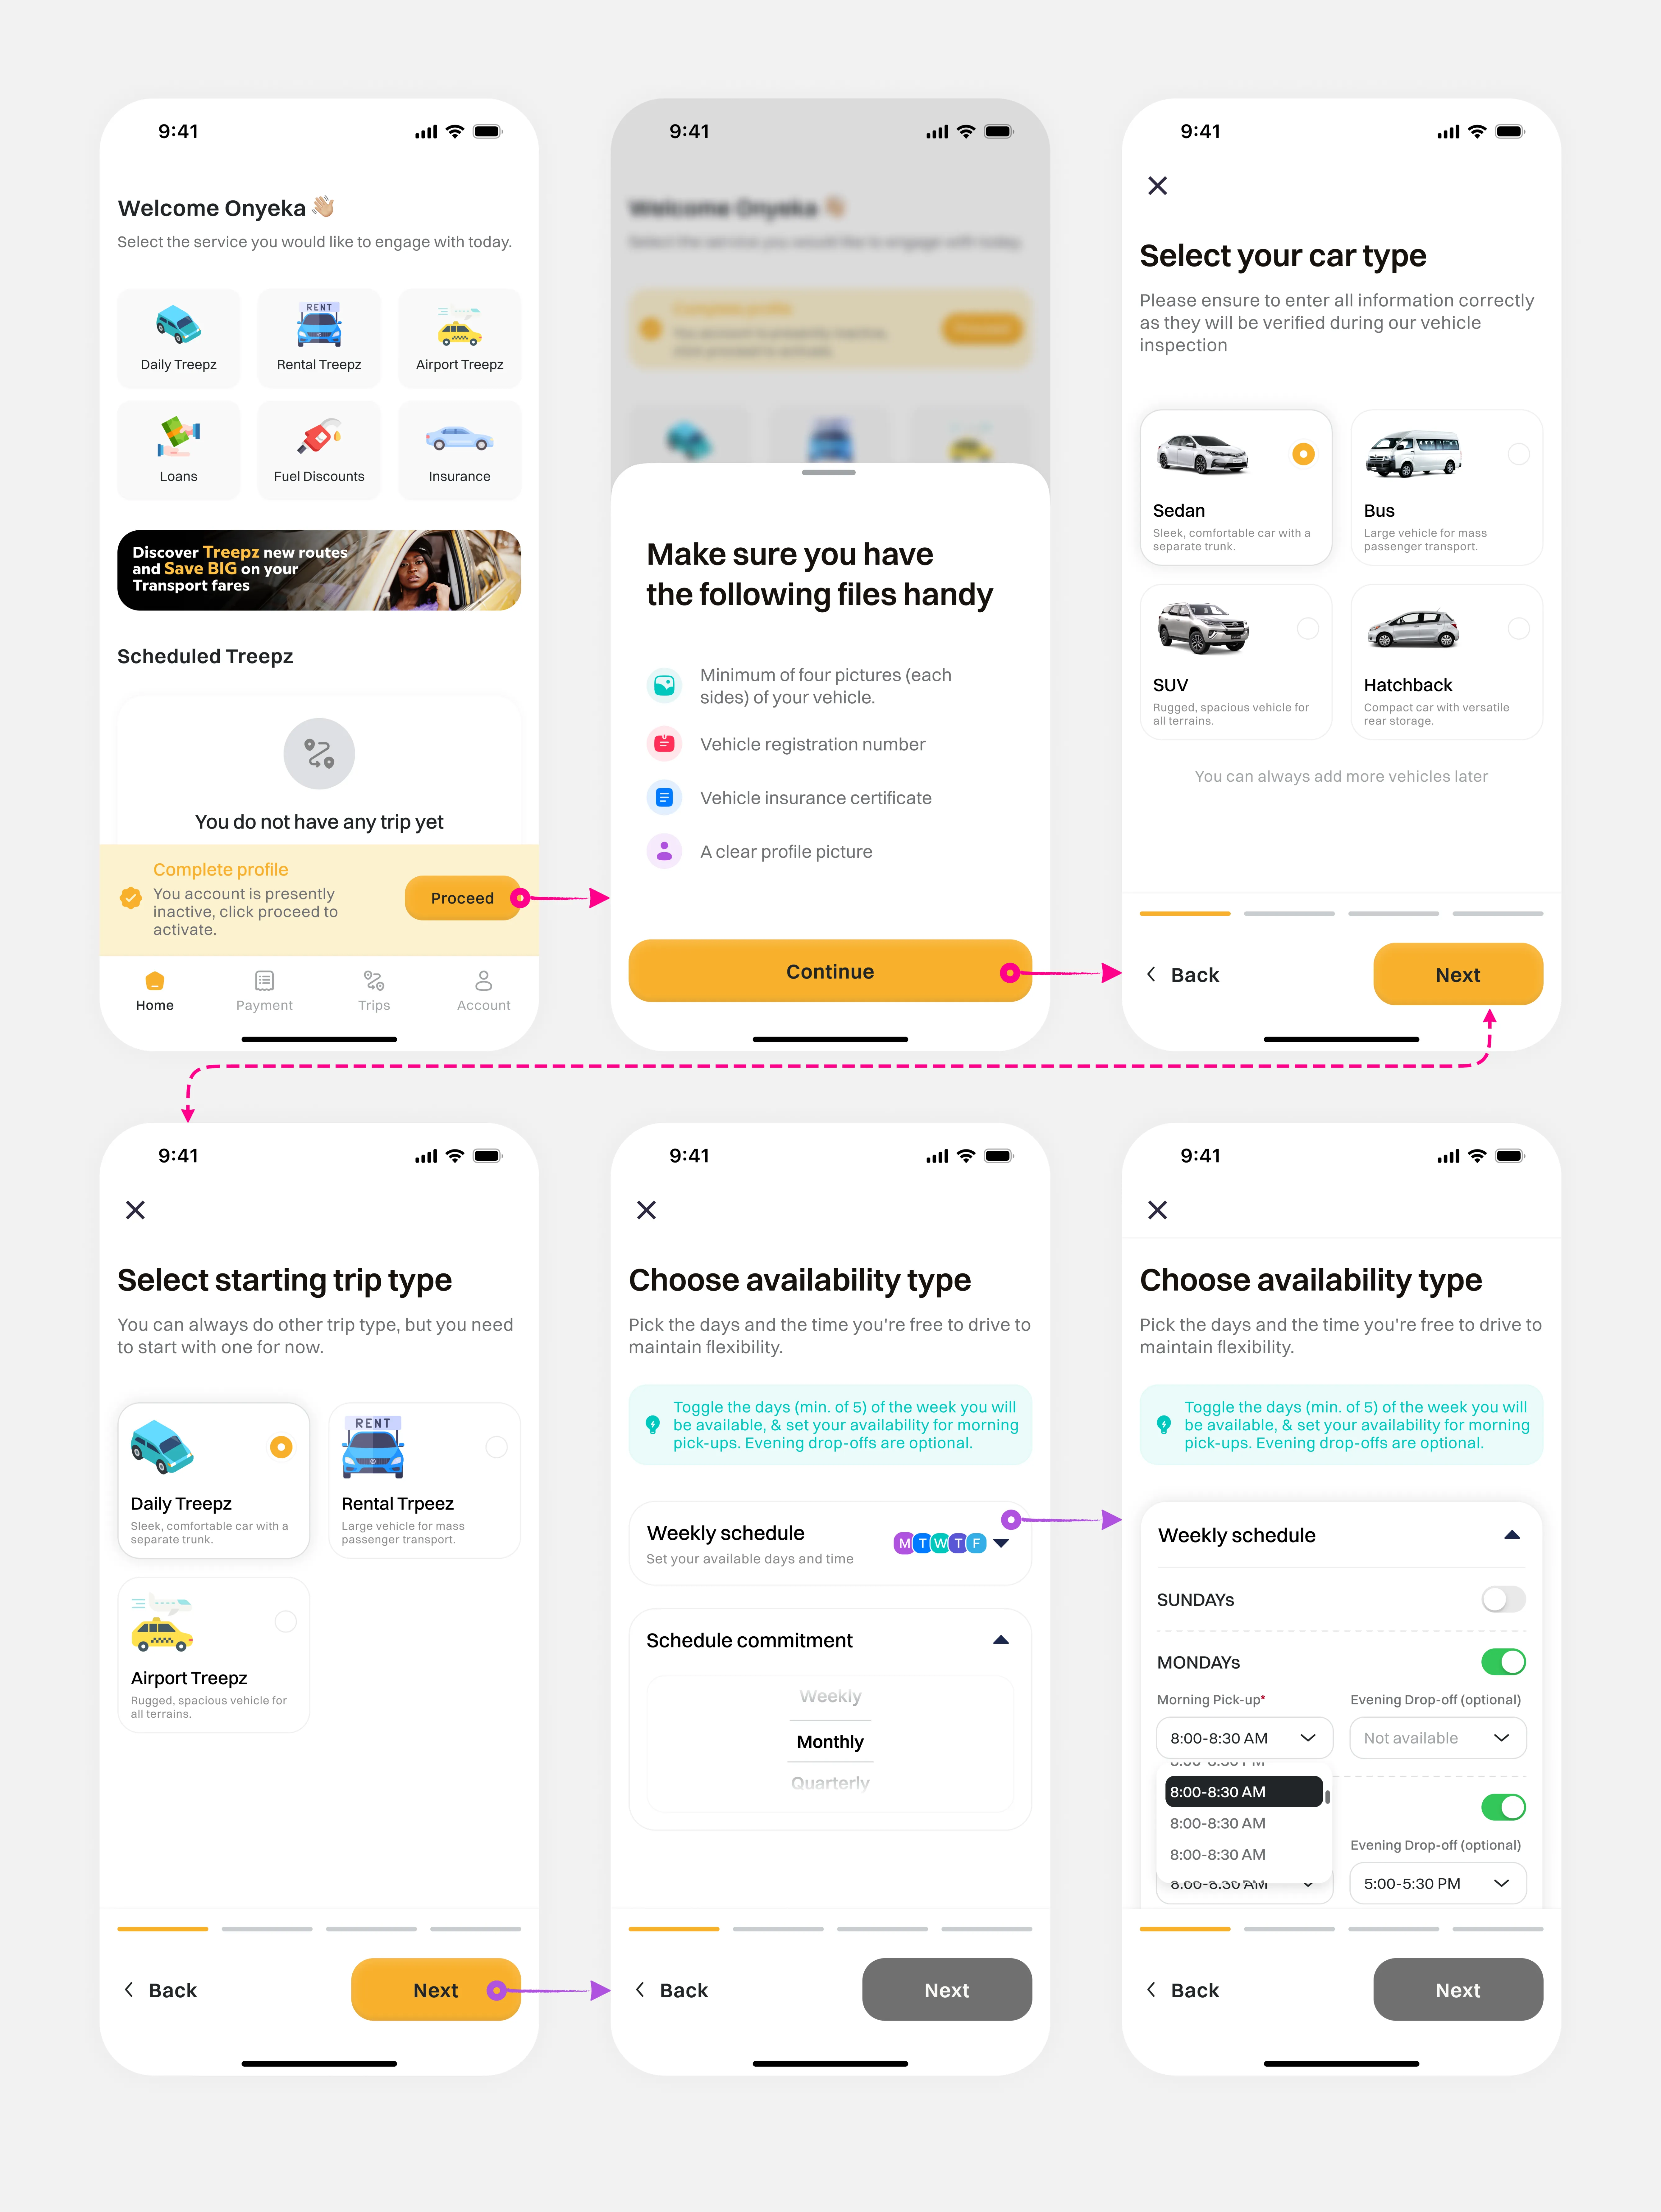
We recognized early that speed is crucial for platform adoption, so we streamlined the signup process to be both fast and intuitive. New users entering via rental, airport, or daily trips only need to provide basic information and create a password, with real-time guidance on password requirements. Conversely, users accessing Business Treepz (primarily by invitation) are only asked to submit their personal email address and phone number when they wish to use any of the other services. The progressive disclosure approach presents relevant information at optimal moments, reducing cognitive load while building user confidence. During usability testing, the average signup time was just 50 seconds.
After introducing progressive disclosure and context-specific welcome flows, our onboarding completion rate increased from 62% to 89%.
2. Ride Scheduling - Daily and Rental Treepz
In the mobility world, speed is everything. Some customers only book a ride just before they need to travel, but they still expect punctual service. To address this, we have built the concept of speed directly into our platform. For daily, rental, and airport Treepz services, users are encouraged to schedule their trips in advance. Upon signing in, users' locations are captured (with their permission), after which they select one of the four available services in just three quick steps. For daily Treepz, users can either book a car exclusively for themselves (similar to Uber) or choose to share the ride with others, making it more cost-effective by splitting the fare among up to two passengers.
Trip scheduling must be completed at least 72 hours before the trip date. After selecting the date and time, users can book the ride for themselves or even for someone else, then proceed to pay via the Treepz wallet or online. Once payment is processed, the booking is confirmed. Rental Treepz follows a similar flow, but users must also select a vehicle type and specify the date and duration of the trip. We have streamlined this process, reducing the number of clicks from six in the initial design to just two in the final version.
3. Business Treepz
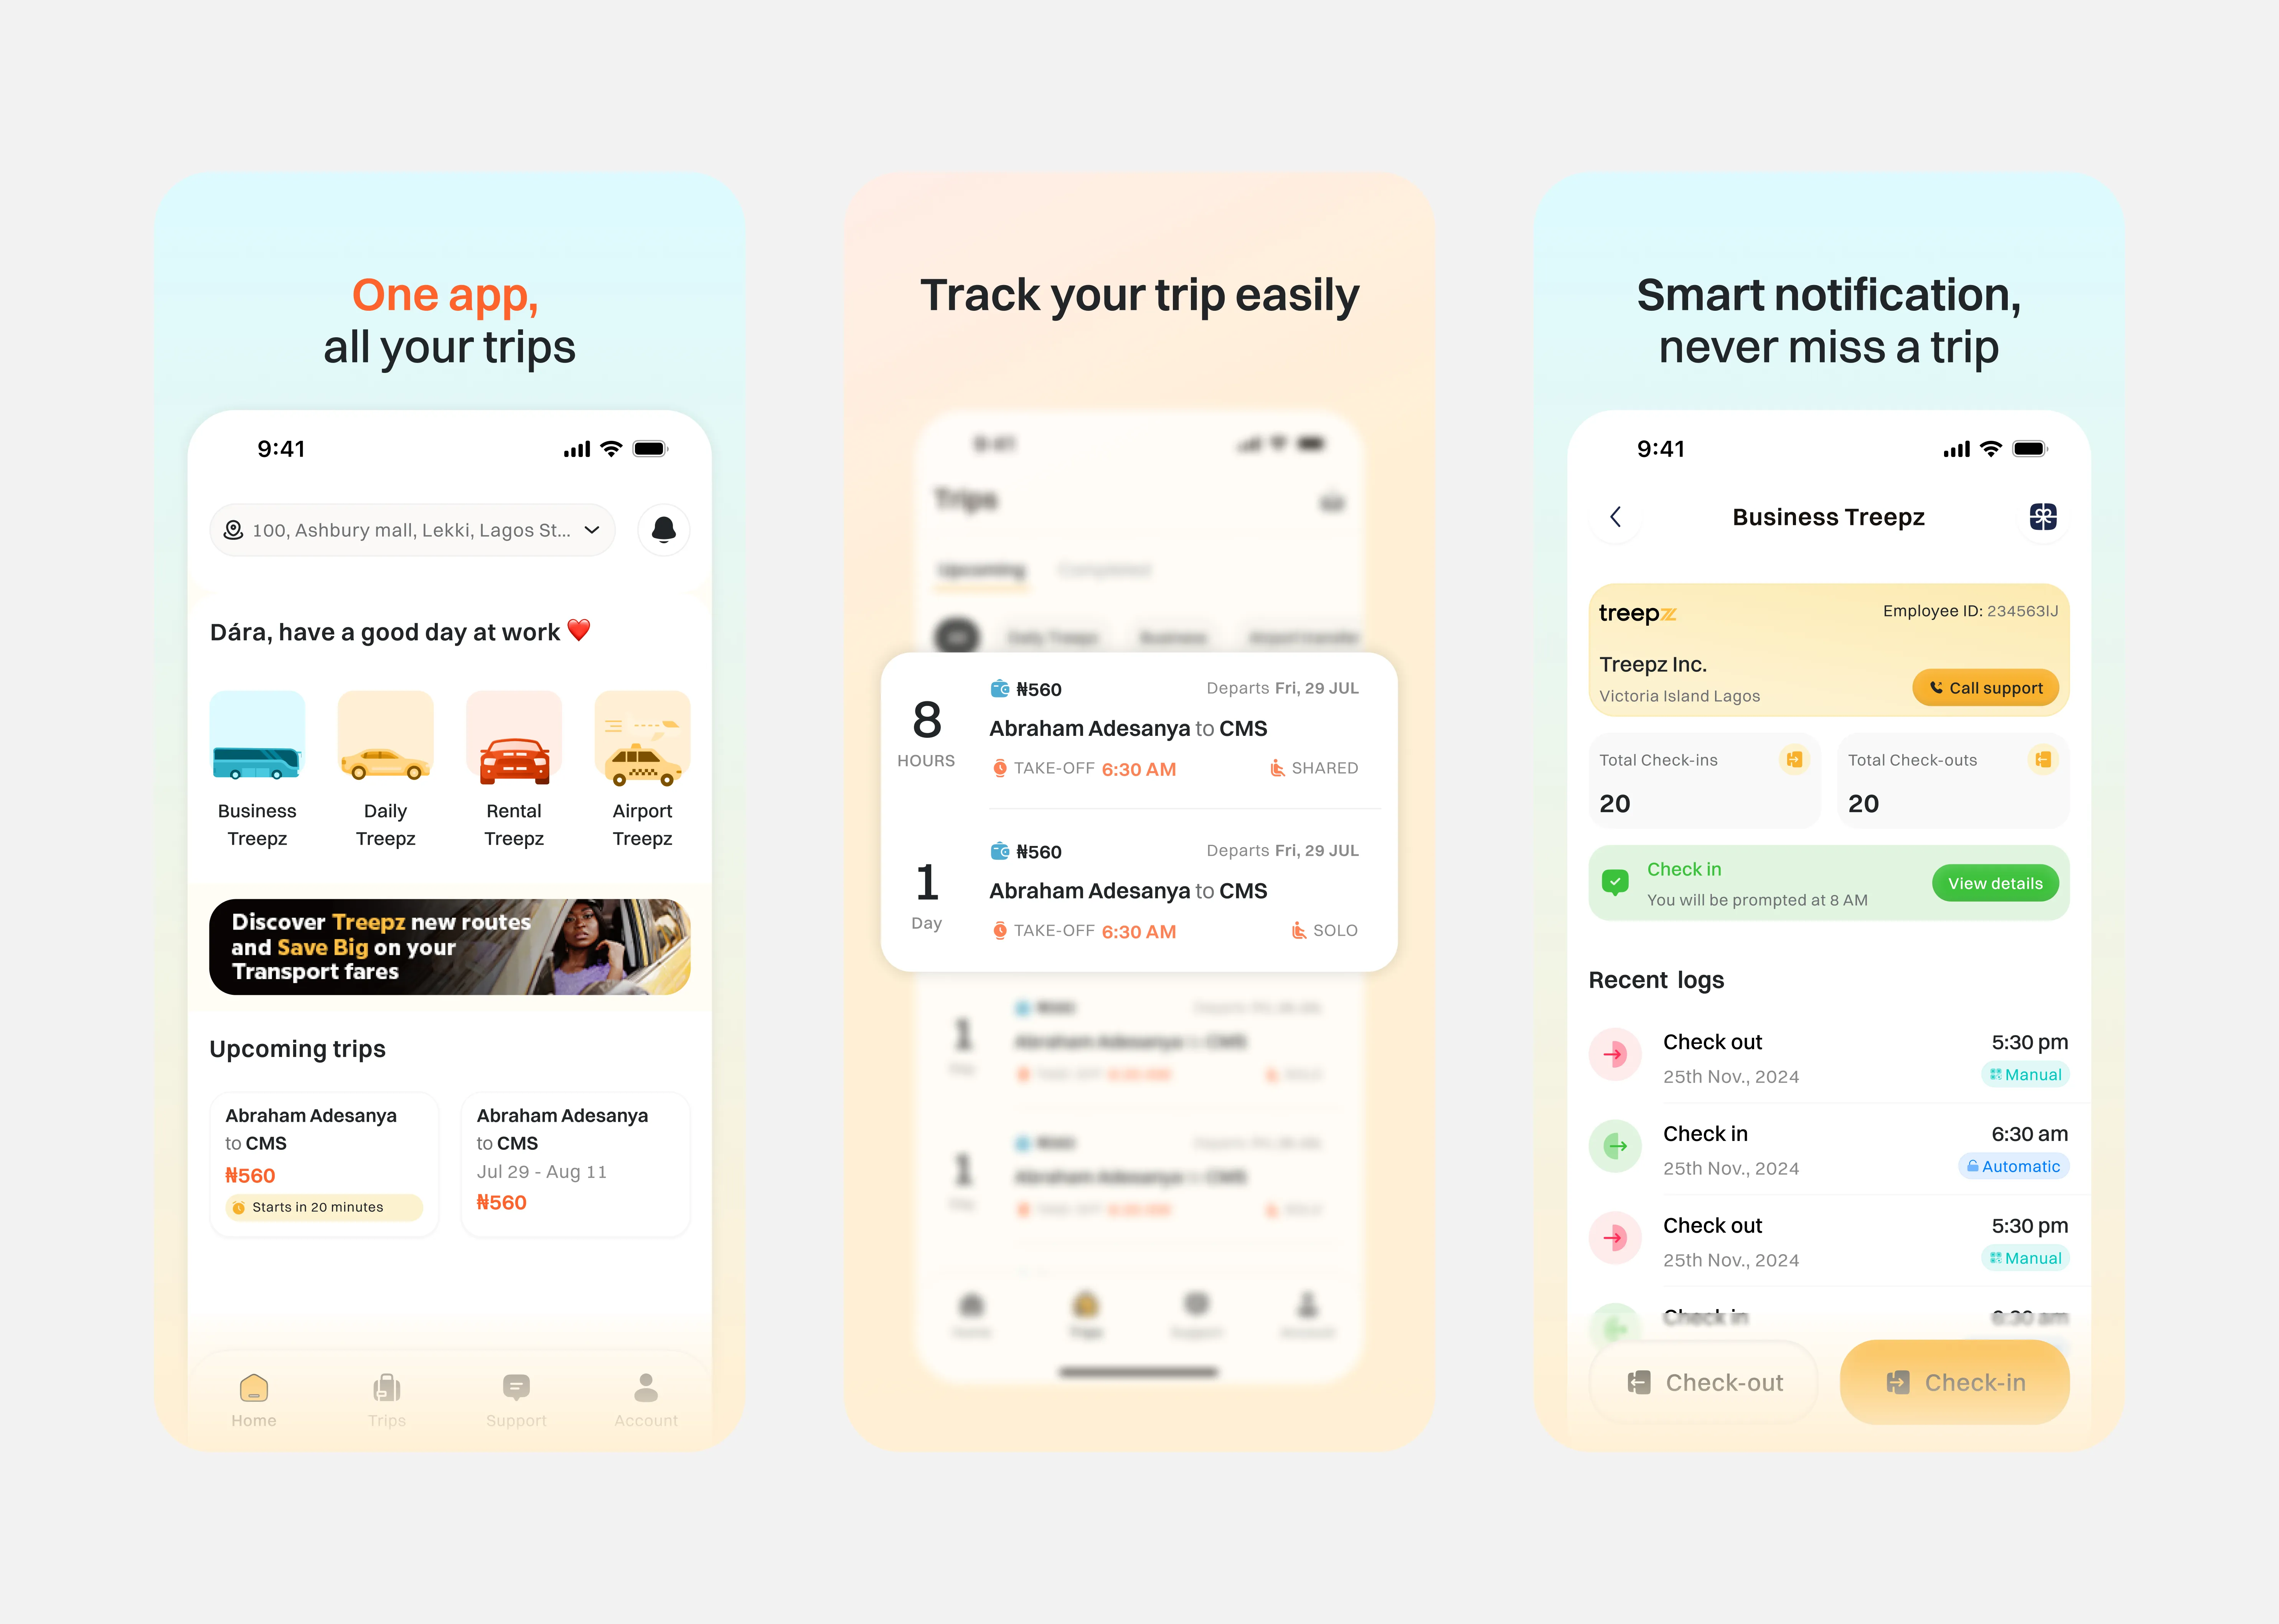
We conducted extensive brainstorming to address the reality that Business Treepz operates as a B2B service, even though it shares the same container/app as three other B2C services. This required us to adopt a different approach. I proposed creating a dedicated dashboard within the app for Business Treepz so that when users click on it, they immediately recognize they are entering a distinct section. Therefore, we introduced a bottom sheet that displays specific information when a user accesses Business Treepz for the first time. During our pilot test with one of our existing business customers, we realized that real-time check-in adoption was low, prompting us to iterate on the check-in scheduling feature with geofencing. This update allows employees to check in and out daily or weekly, with their log confirmed upon entering the company's geofenced location.
4. Trip Monitoring
Real-time tracking and communication keep all stakeholders informed throughout every journey. In the MVP, integrating real-time tracking on the map was deemed non-essential to the user experience, so I recommended postponing its implementation until we gather sufficient usage data. This approach helps us reduce service costs, enabling us to charge our users less. Users can monitor estimated arrival times, call their designated driver, and access emergency support features, ensuring transparency and safety for both business commutes and event transportation. Additionally, customers can view their completed and scheduled trip details via a dedicated menu tab.
In future iterations, integrating instant messaging and in-app calling features could further lower the cost burden on users.
5. Wallet
The wallet became essential because our services are scheduling-oriented, and having a wallet makes payments and refunds easier from both operational and user perspectives. Users can easily see their wallet balance on the homepage and fund it directly from there. In settings, users can set their default payment method, choosing between the Treepz Wallet and online debit card payment. To make it easier for users to track wallet and payment activities, we designed and implemented a comprehensive transaction history with robust filtering and report download options.
Mobile App for Drivers
The Driver's app powers the user app and even the back office, so we have to pay great attention to ensuring it serves the needs of the users powering our services.
1. Onboarding and Vehicle Documentation
For the driver onboarding flow, I replaced intimidating forms with a conversational, step-by-step approach that begins with a friendly modal clearly outlining required documents (vehicle photos, registration, insurance, and profile picture). This preparation step reduces anxiety before guiding drivers through a clean card-style interface for vehicle selection, trip category preferences, and availability settings, all supported by subtle progress indicators and clear navigation.
By breaking down this potentially overwhelming process into manageable chunks with intuitive toggles and time pickers, we significantly enhanced driver confidence and reduced errors. Testing confirmed this streamlined approach enabled drivers to more efficiently configure their service preferences, schedules, and operating areas without the confusion and abandonment rates we observed in earlier prototypes.
By digitizing document verification and implementing clear progress indicators, we successfully reduced driver onboarding time from 5 days to just 2 days.
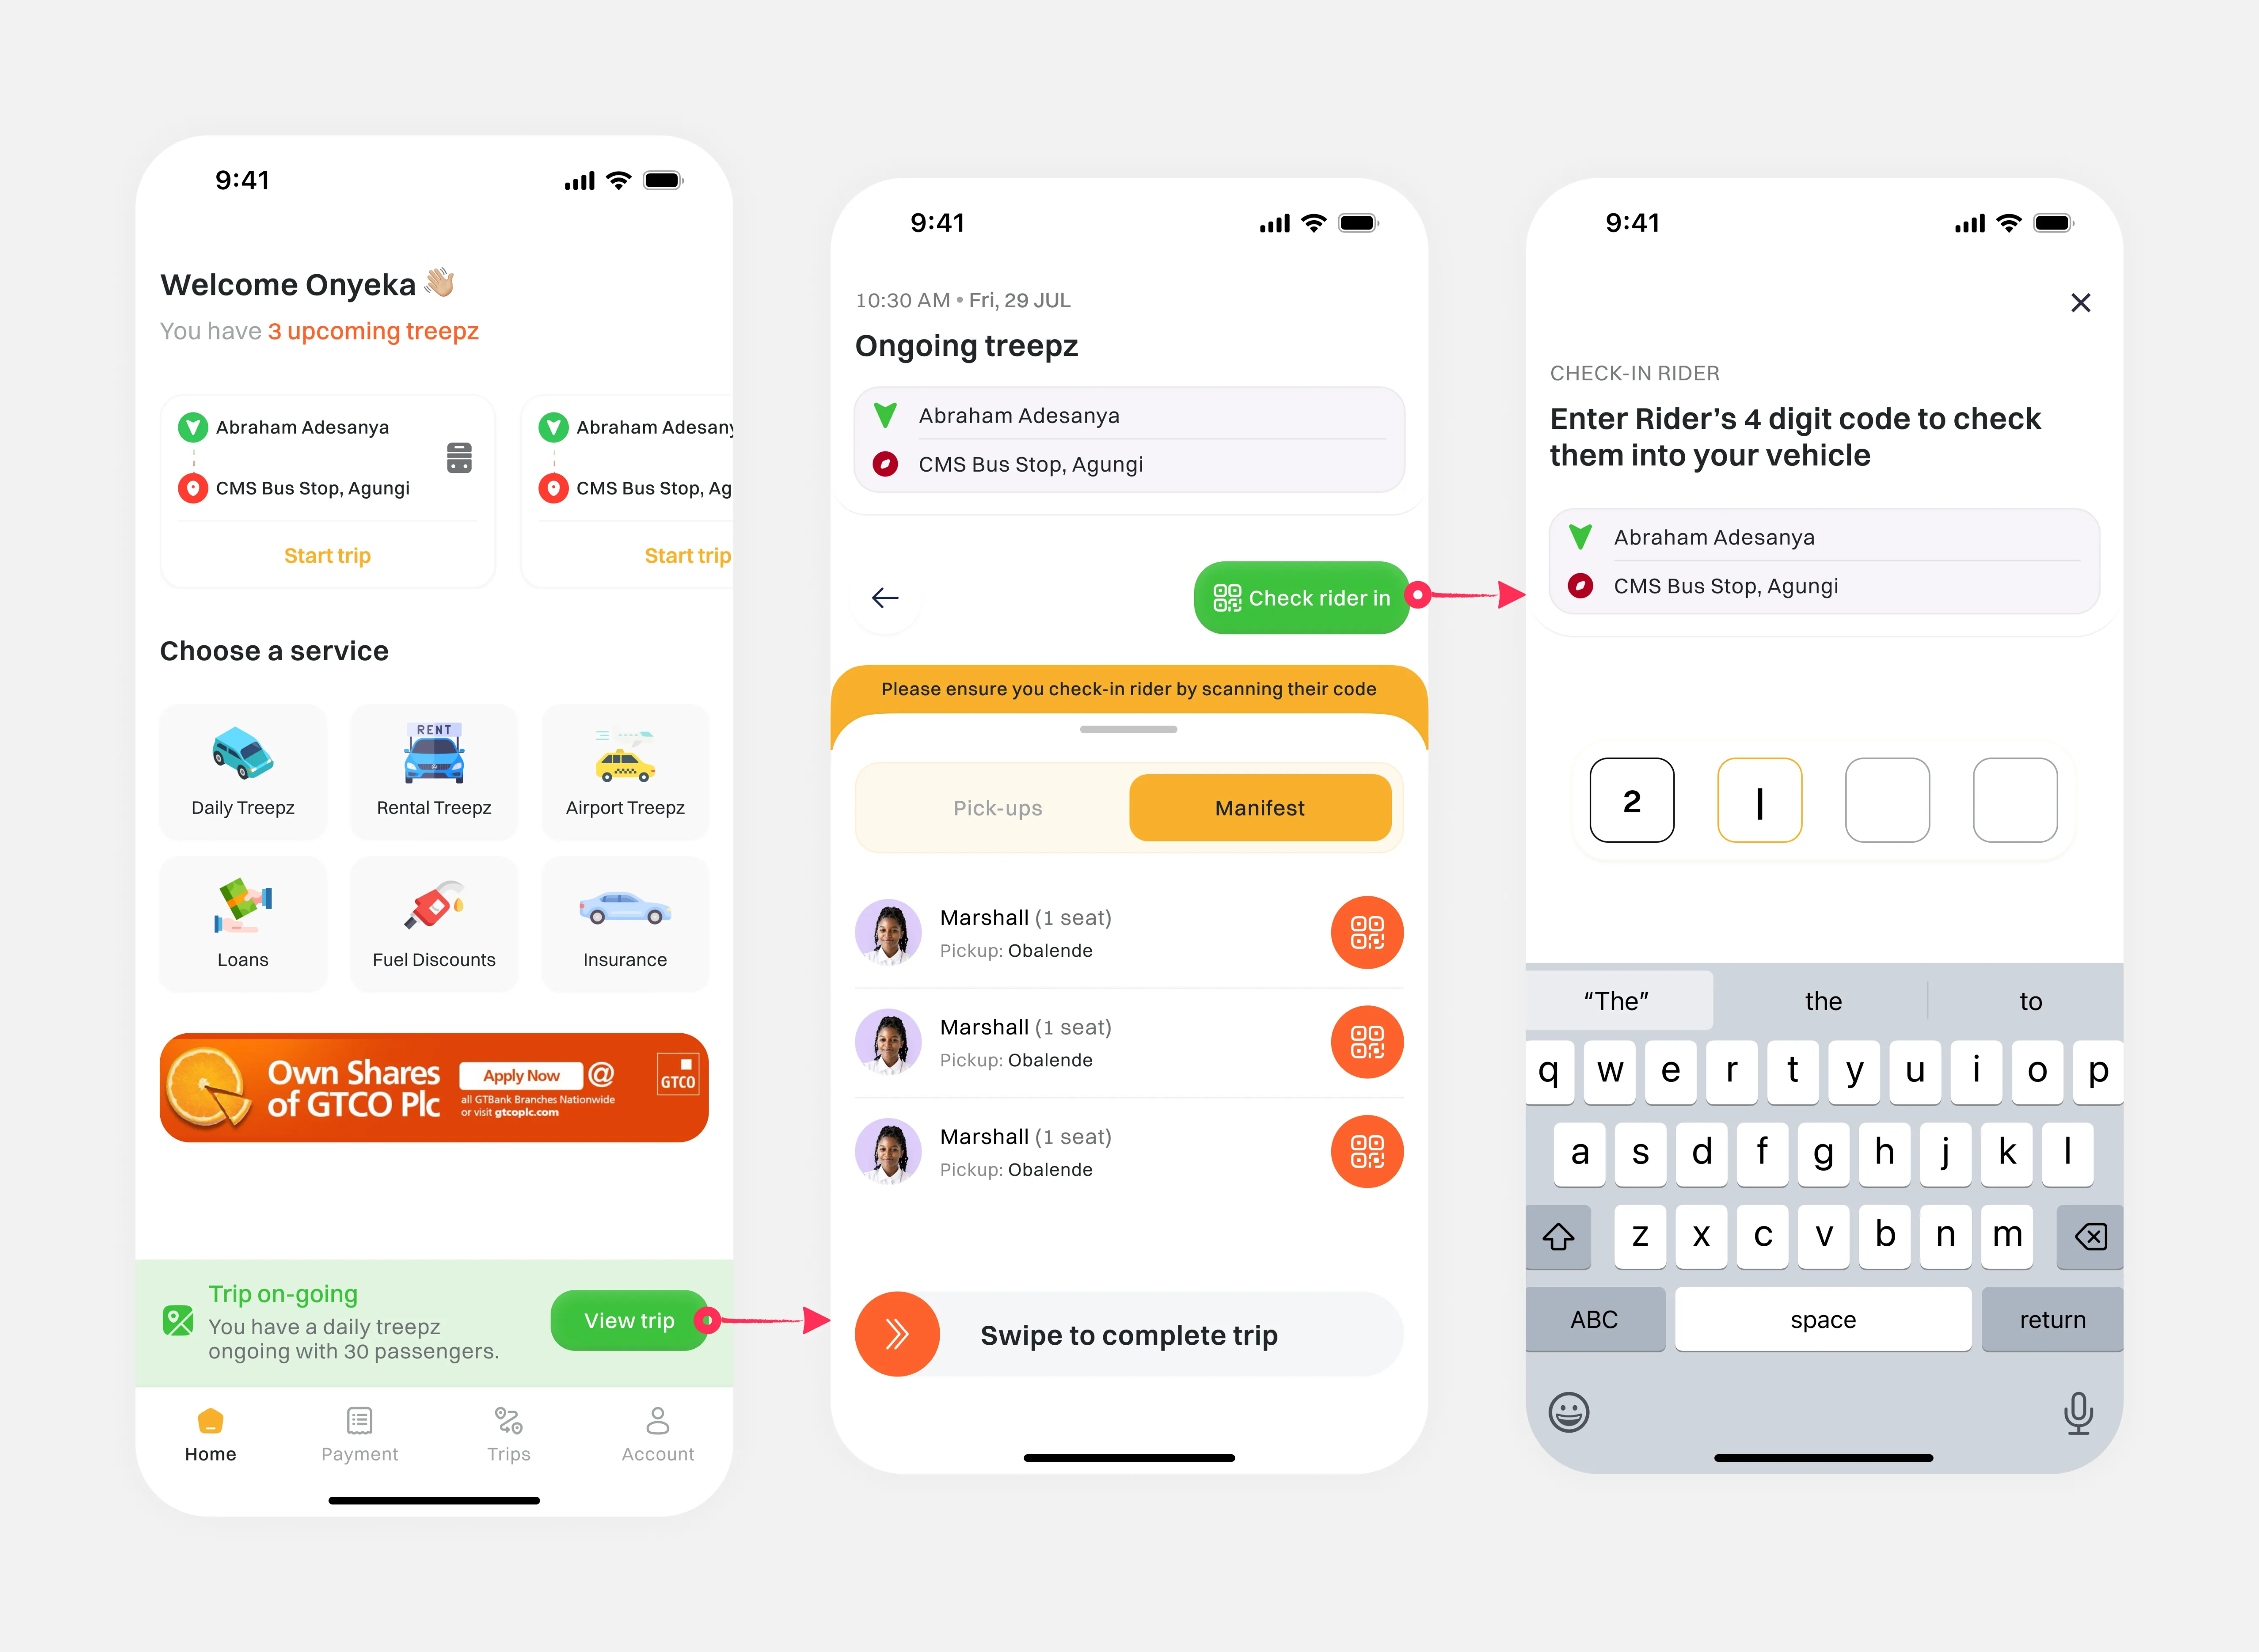
2. Trips
Once on the road, drivers land on a dynamic home screen displaying upcoming and ongoing trips. Tapping "View trip" slides in a detailed trip view with two modes: Pick-ups and Manifest. In Pick-ups, drivers scan or enter each rider's four-digit code to check them in, ensuring accuracy and security. Switching to Manifest shows passenger names, seat counts, and pickup points at a glance, with a clear "Check rider in" button beside each entry. After everyone is aboard, a "Swipe to complete trip" bar seals the journey, updating the dashboard and freeing the driver for the next assignment. Throughout, contextual cues (green status banners, progress bars, and back/next controls) keep the flow intuitive and minimize errors, letting drivers focus on the road, not the app.
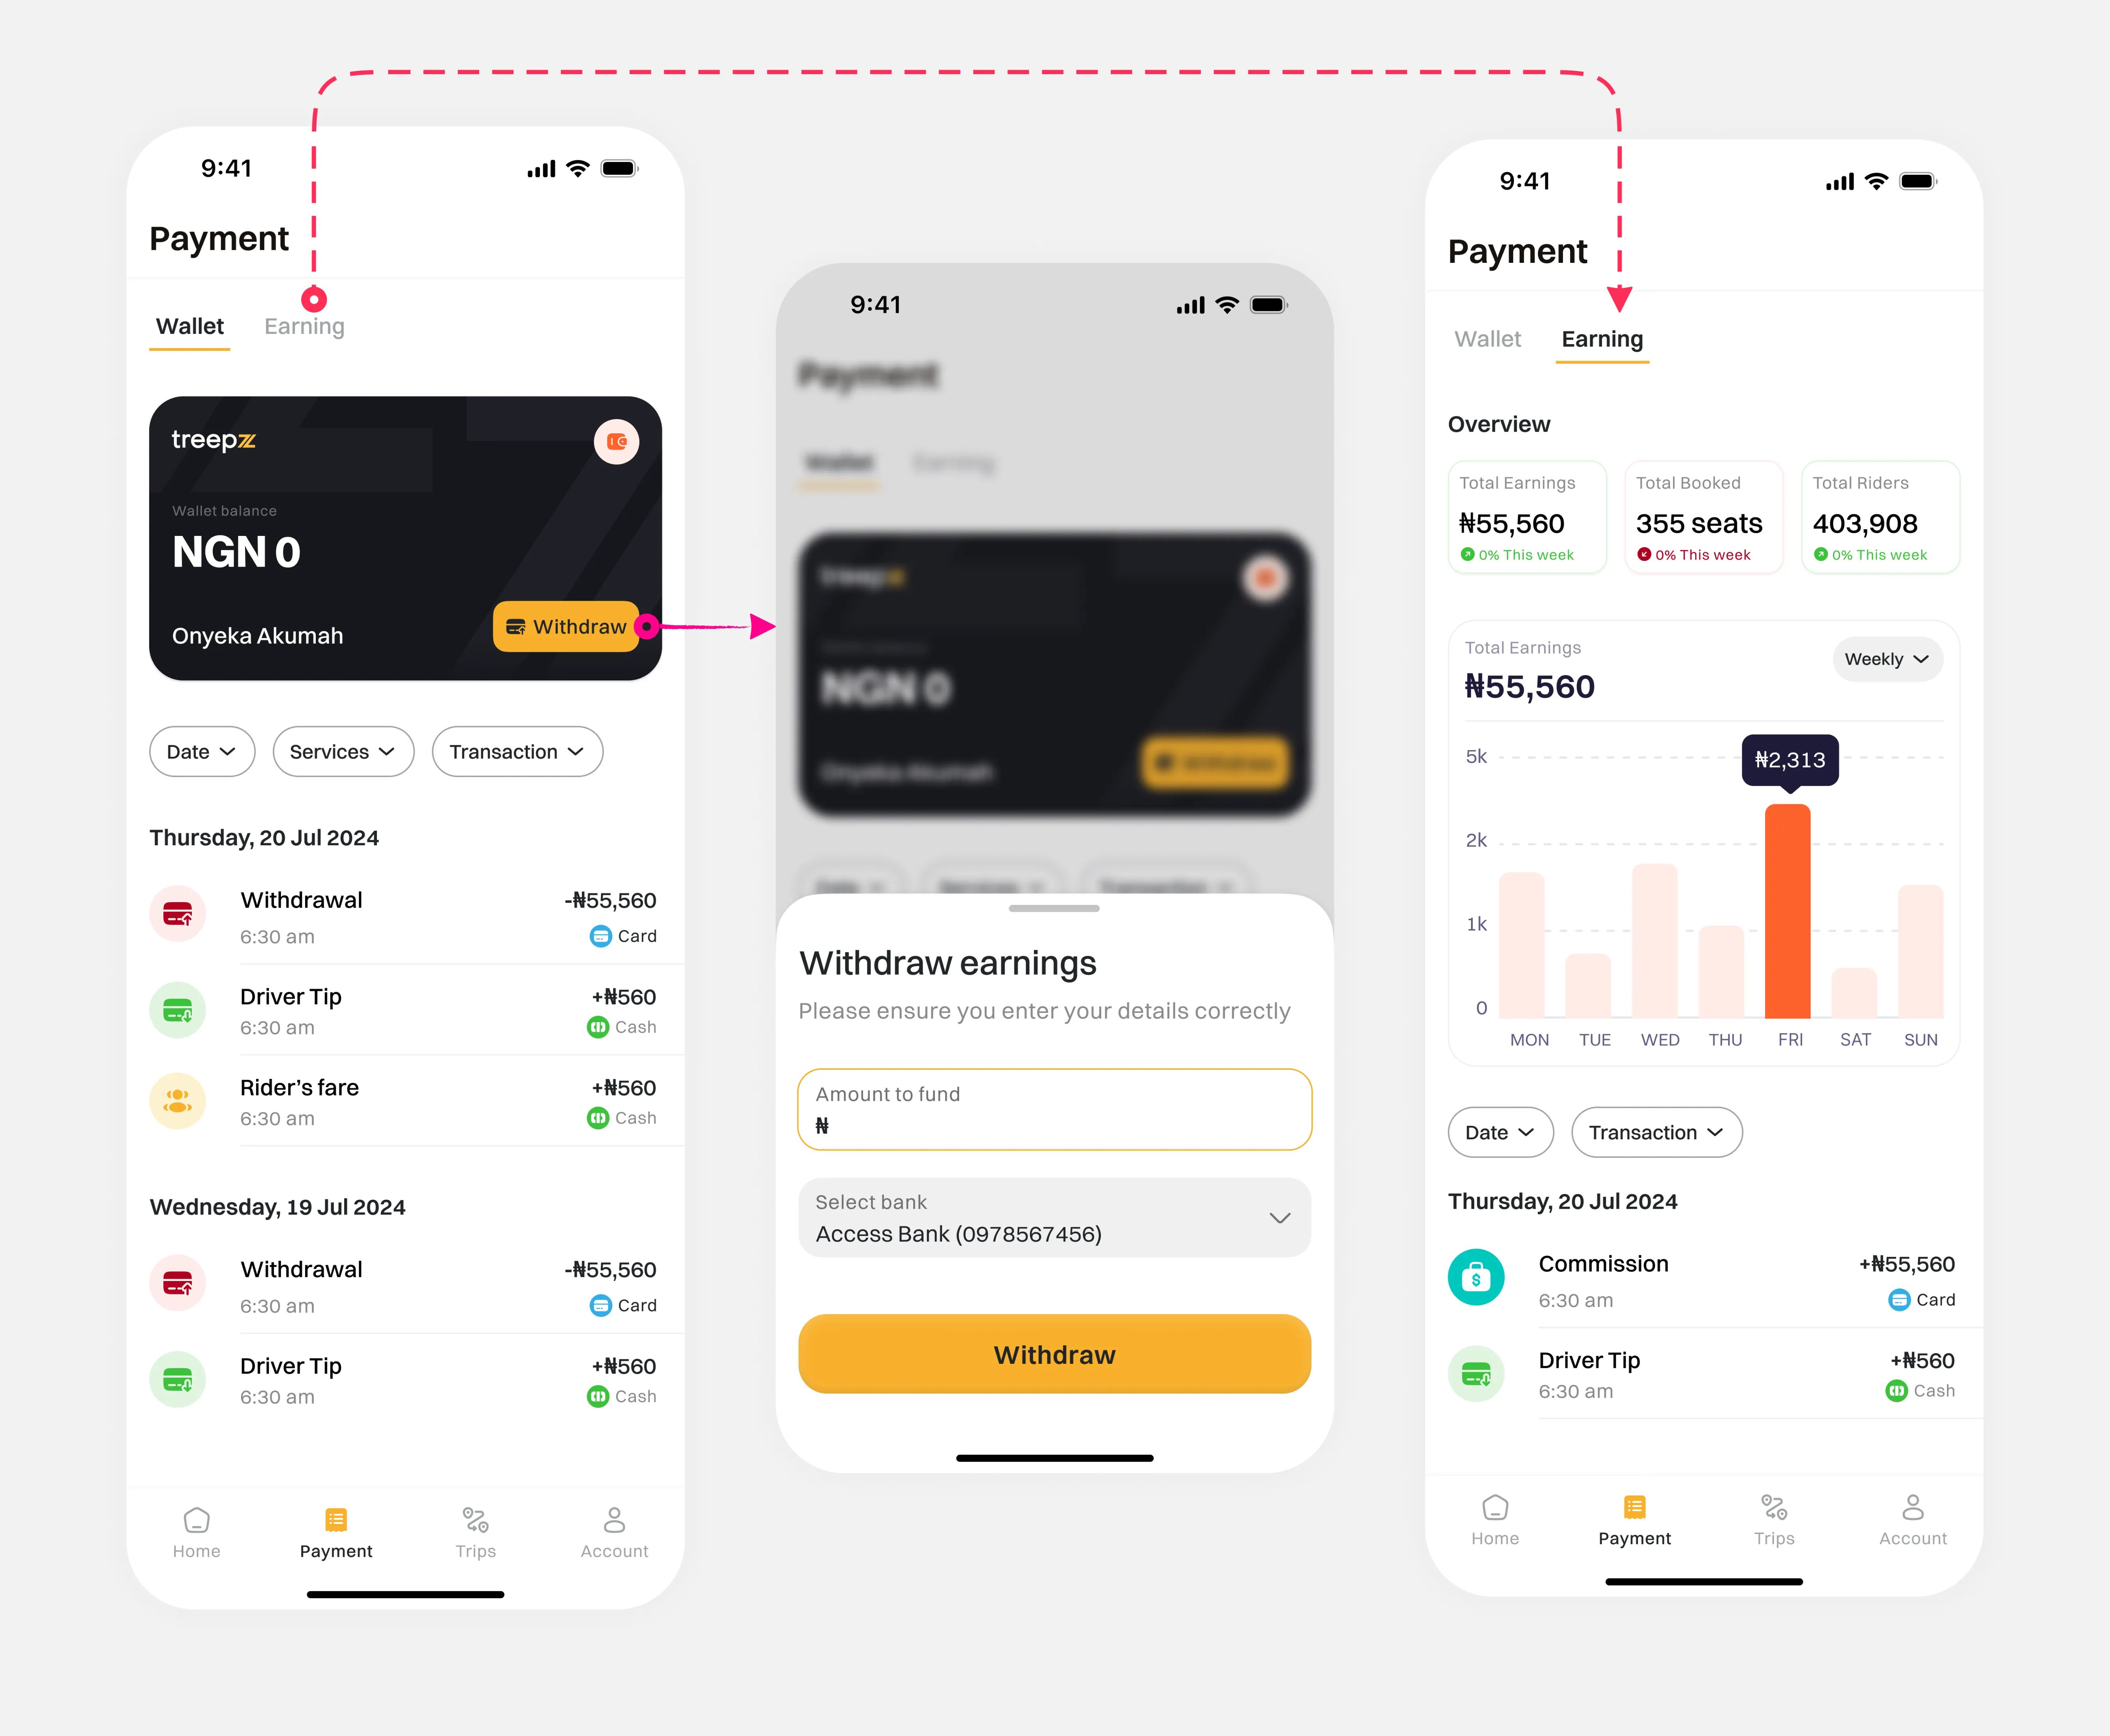
3. Earnings & Wallet
Given that drivers' primary goal is to earn and access money quickly, we built the Payment screen around that focus. Under the Wallet tab, drivers see their real-time balance and a clear activity feed. Tapping "Withdraw" brings up a simple bottom sheet to enter an amount and select a bank, allowing them to get paid in just a couple of taps. The Earning tab surfaces the most important metrics (total earnings, seats booked, riders served) alongside a bar chart keyed to morning and evening peak hours (68% of trips) and filters for date or transaction type. By defaulting to a weekly view that aligns with pay cycles, minimizing fields, and using prominent CTAs, every design decision reduces friction, surfaces high-value data, and keeps drivers focused on what matters most: driving and getting paid.
Business Admin Dashboard
In my design process, I treated the Business Treepz Admin console as the nerve center for corporate clients to both monitor and manage employee transportation with minimal friction. The top-level dashboard surfaces KPIs (total employees, check-ins, and check-outs) alongside a date-range selector and bar chart so HR can instantly spot trends. Below, the Treepz history table lays out each employee's check-in/out timestamps and locations for audit and troubleshooting.
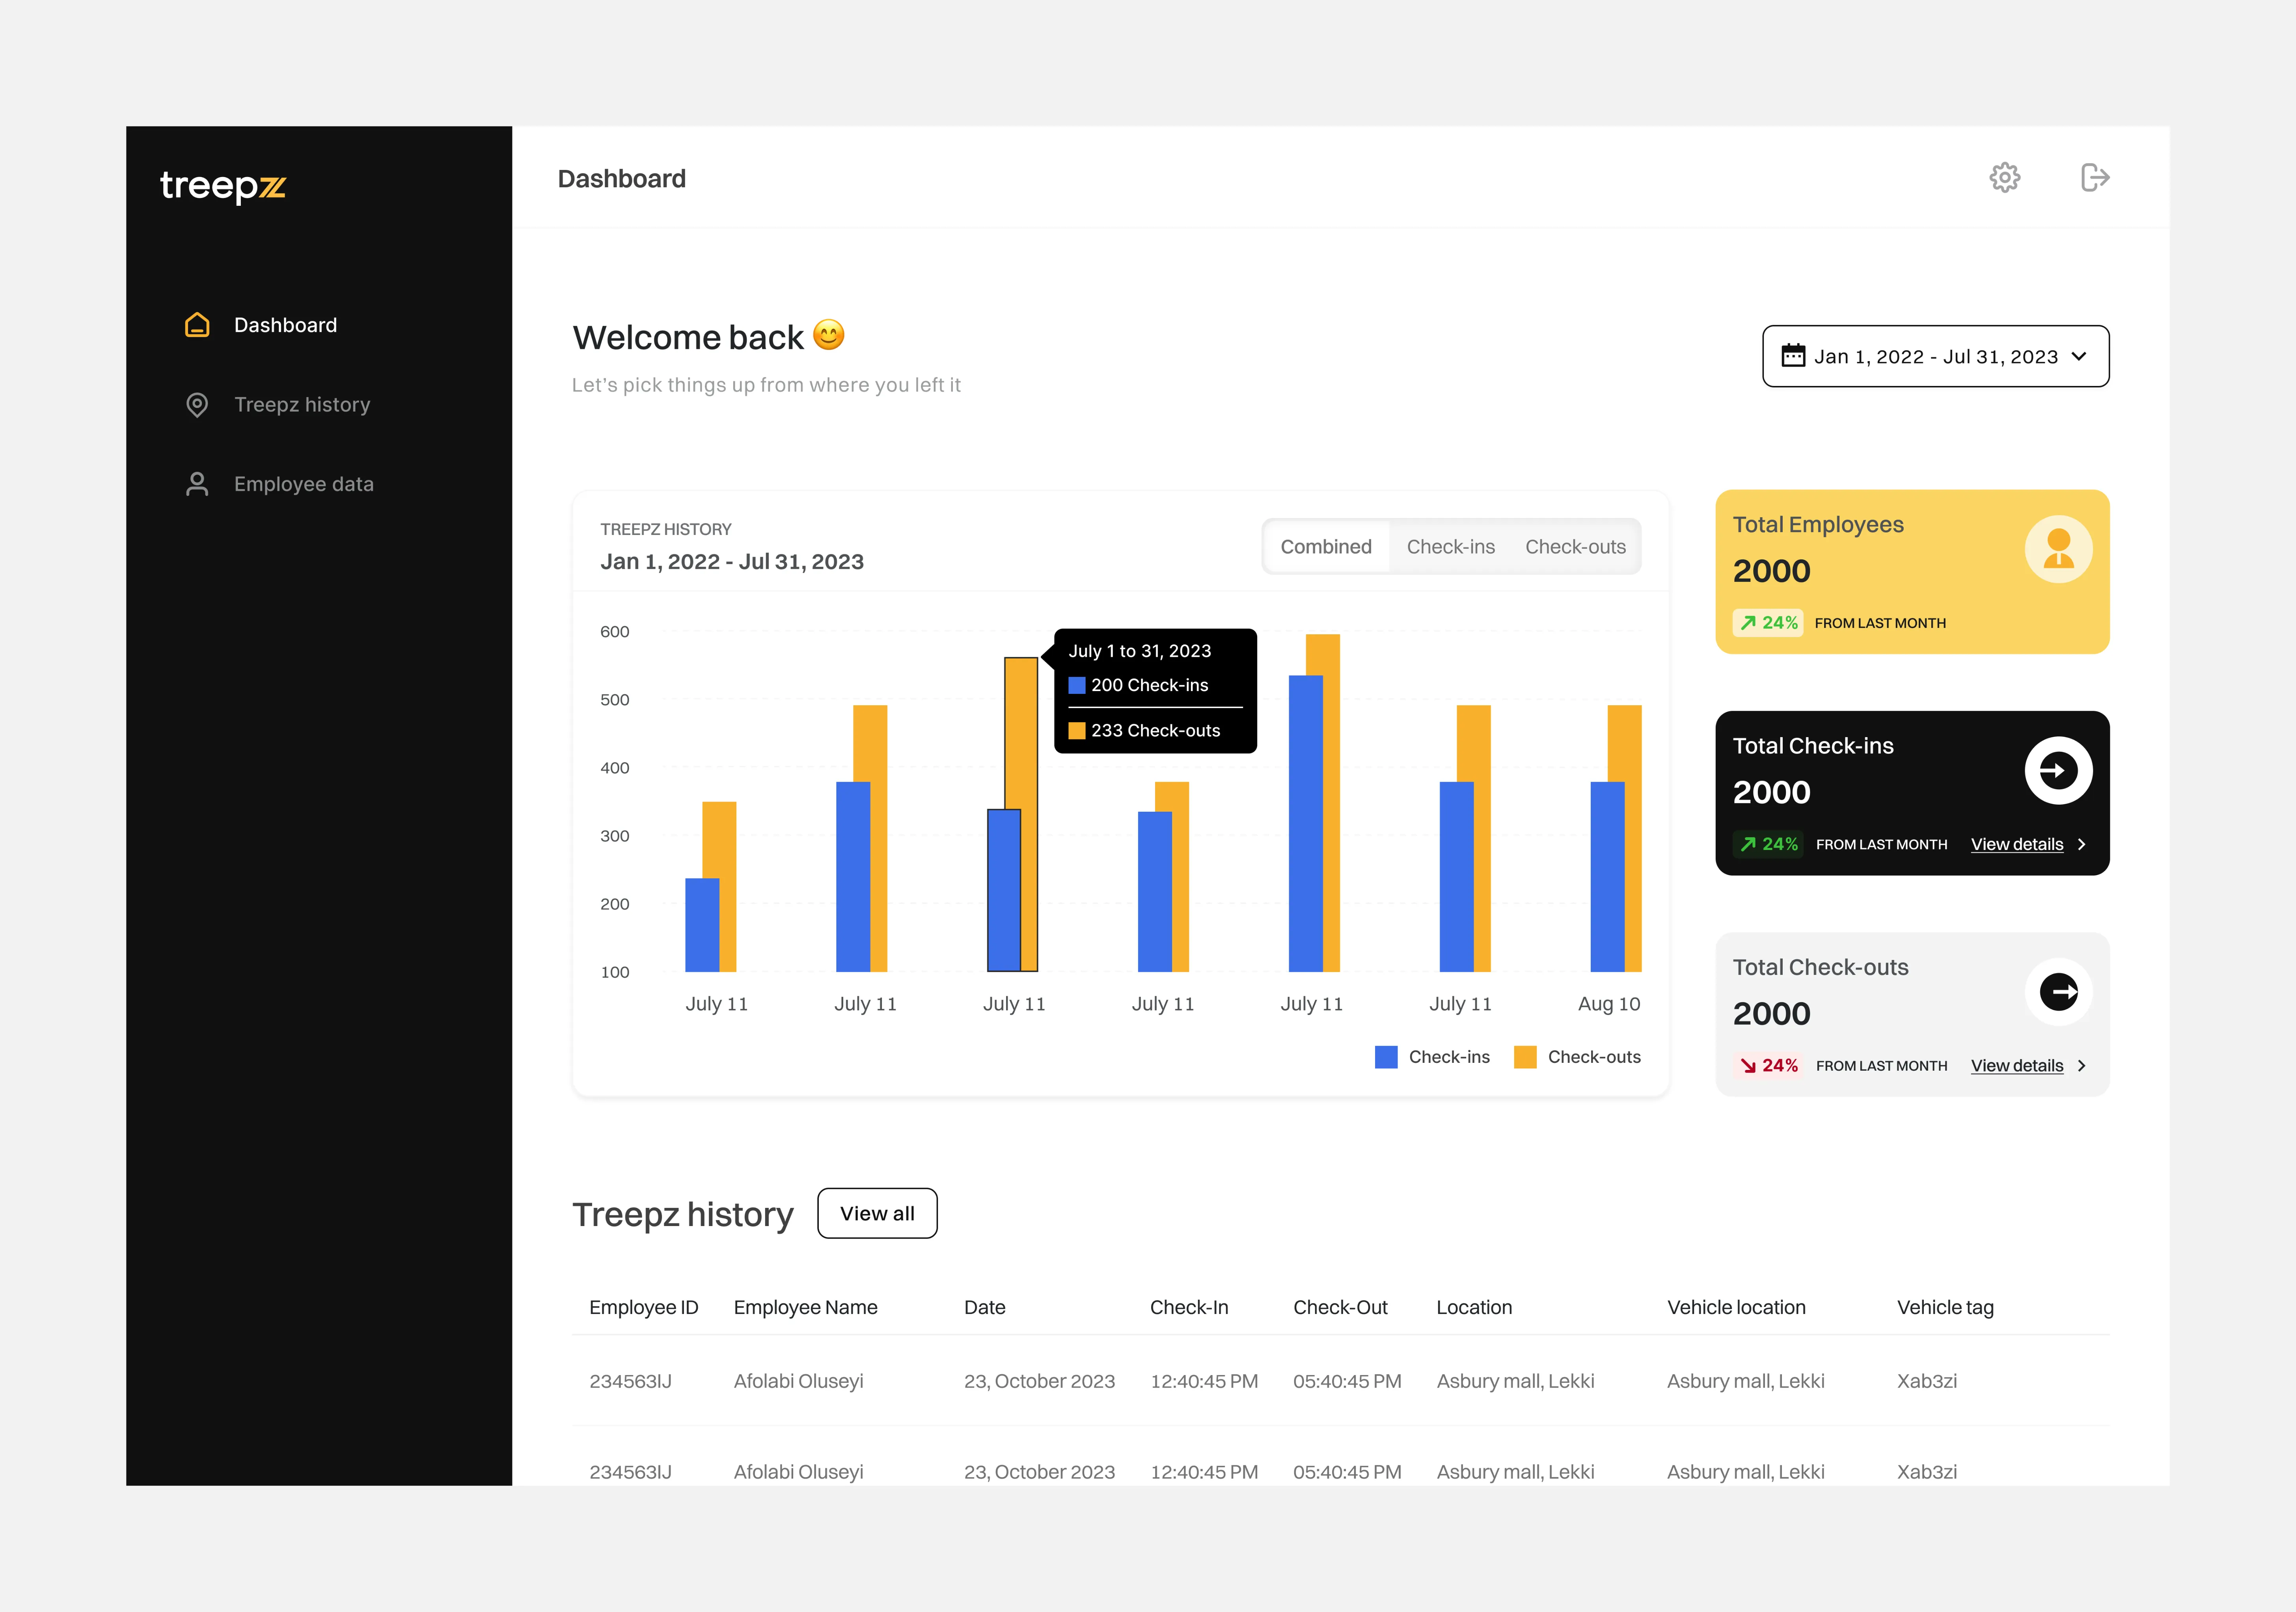
I wove in inline controls for inviting staff, selecting bus types, defining check-in/out windows, setting business locations, and scheduling automated reminders, so managers can configure service parameters without ever leaving the same view. By coupling high-level analytics with on-the-spot configuration, we empowered companies to oversee performance and tweak their transport policies in one unified interface, directly tying the admin UX to the goals of efficiency, transparency, and data-driven decision-making.
Treepz Admin Console
In crafting the Treepz Admin back-office, our operations powerhouse, we treated every element as mission-critical, ensuring that revenue figures, active-ride counts, pending matches, quick-action buttons, and support-ticket feeds all live side-by-side in a single, scannable dashboard. We leaned on the Nielsen heuristic of "visibility of system status," so every KPI (Total Revenue, Active Rides, New Users) updates in real time, pending matches highlight themselves in bold accents, and quick actions (Approve Drivers, Vehicle Inspection, Adjust Routes, Send Notifications) sit at the top for instant reach. By carefully grouping related functions in the sidebar, standardizing card layouts, and color-coding alerts versus metrics, we reduced cognitive load for our ops team, letting them jump from high-level trends to detailed troubleshooting without ever losing context. This level of care turns the console into a true command center where nothing slips through the cracks.
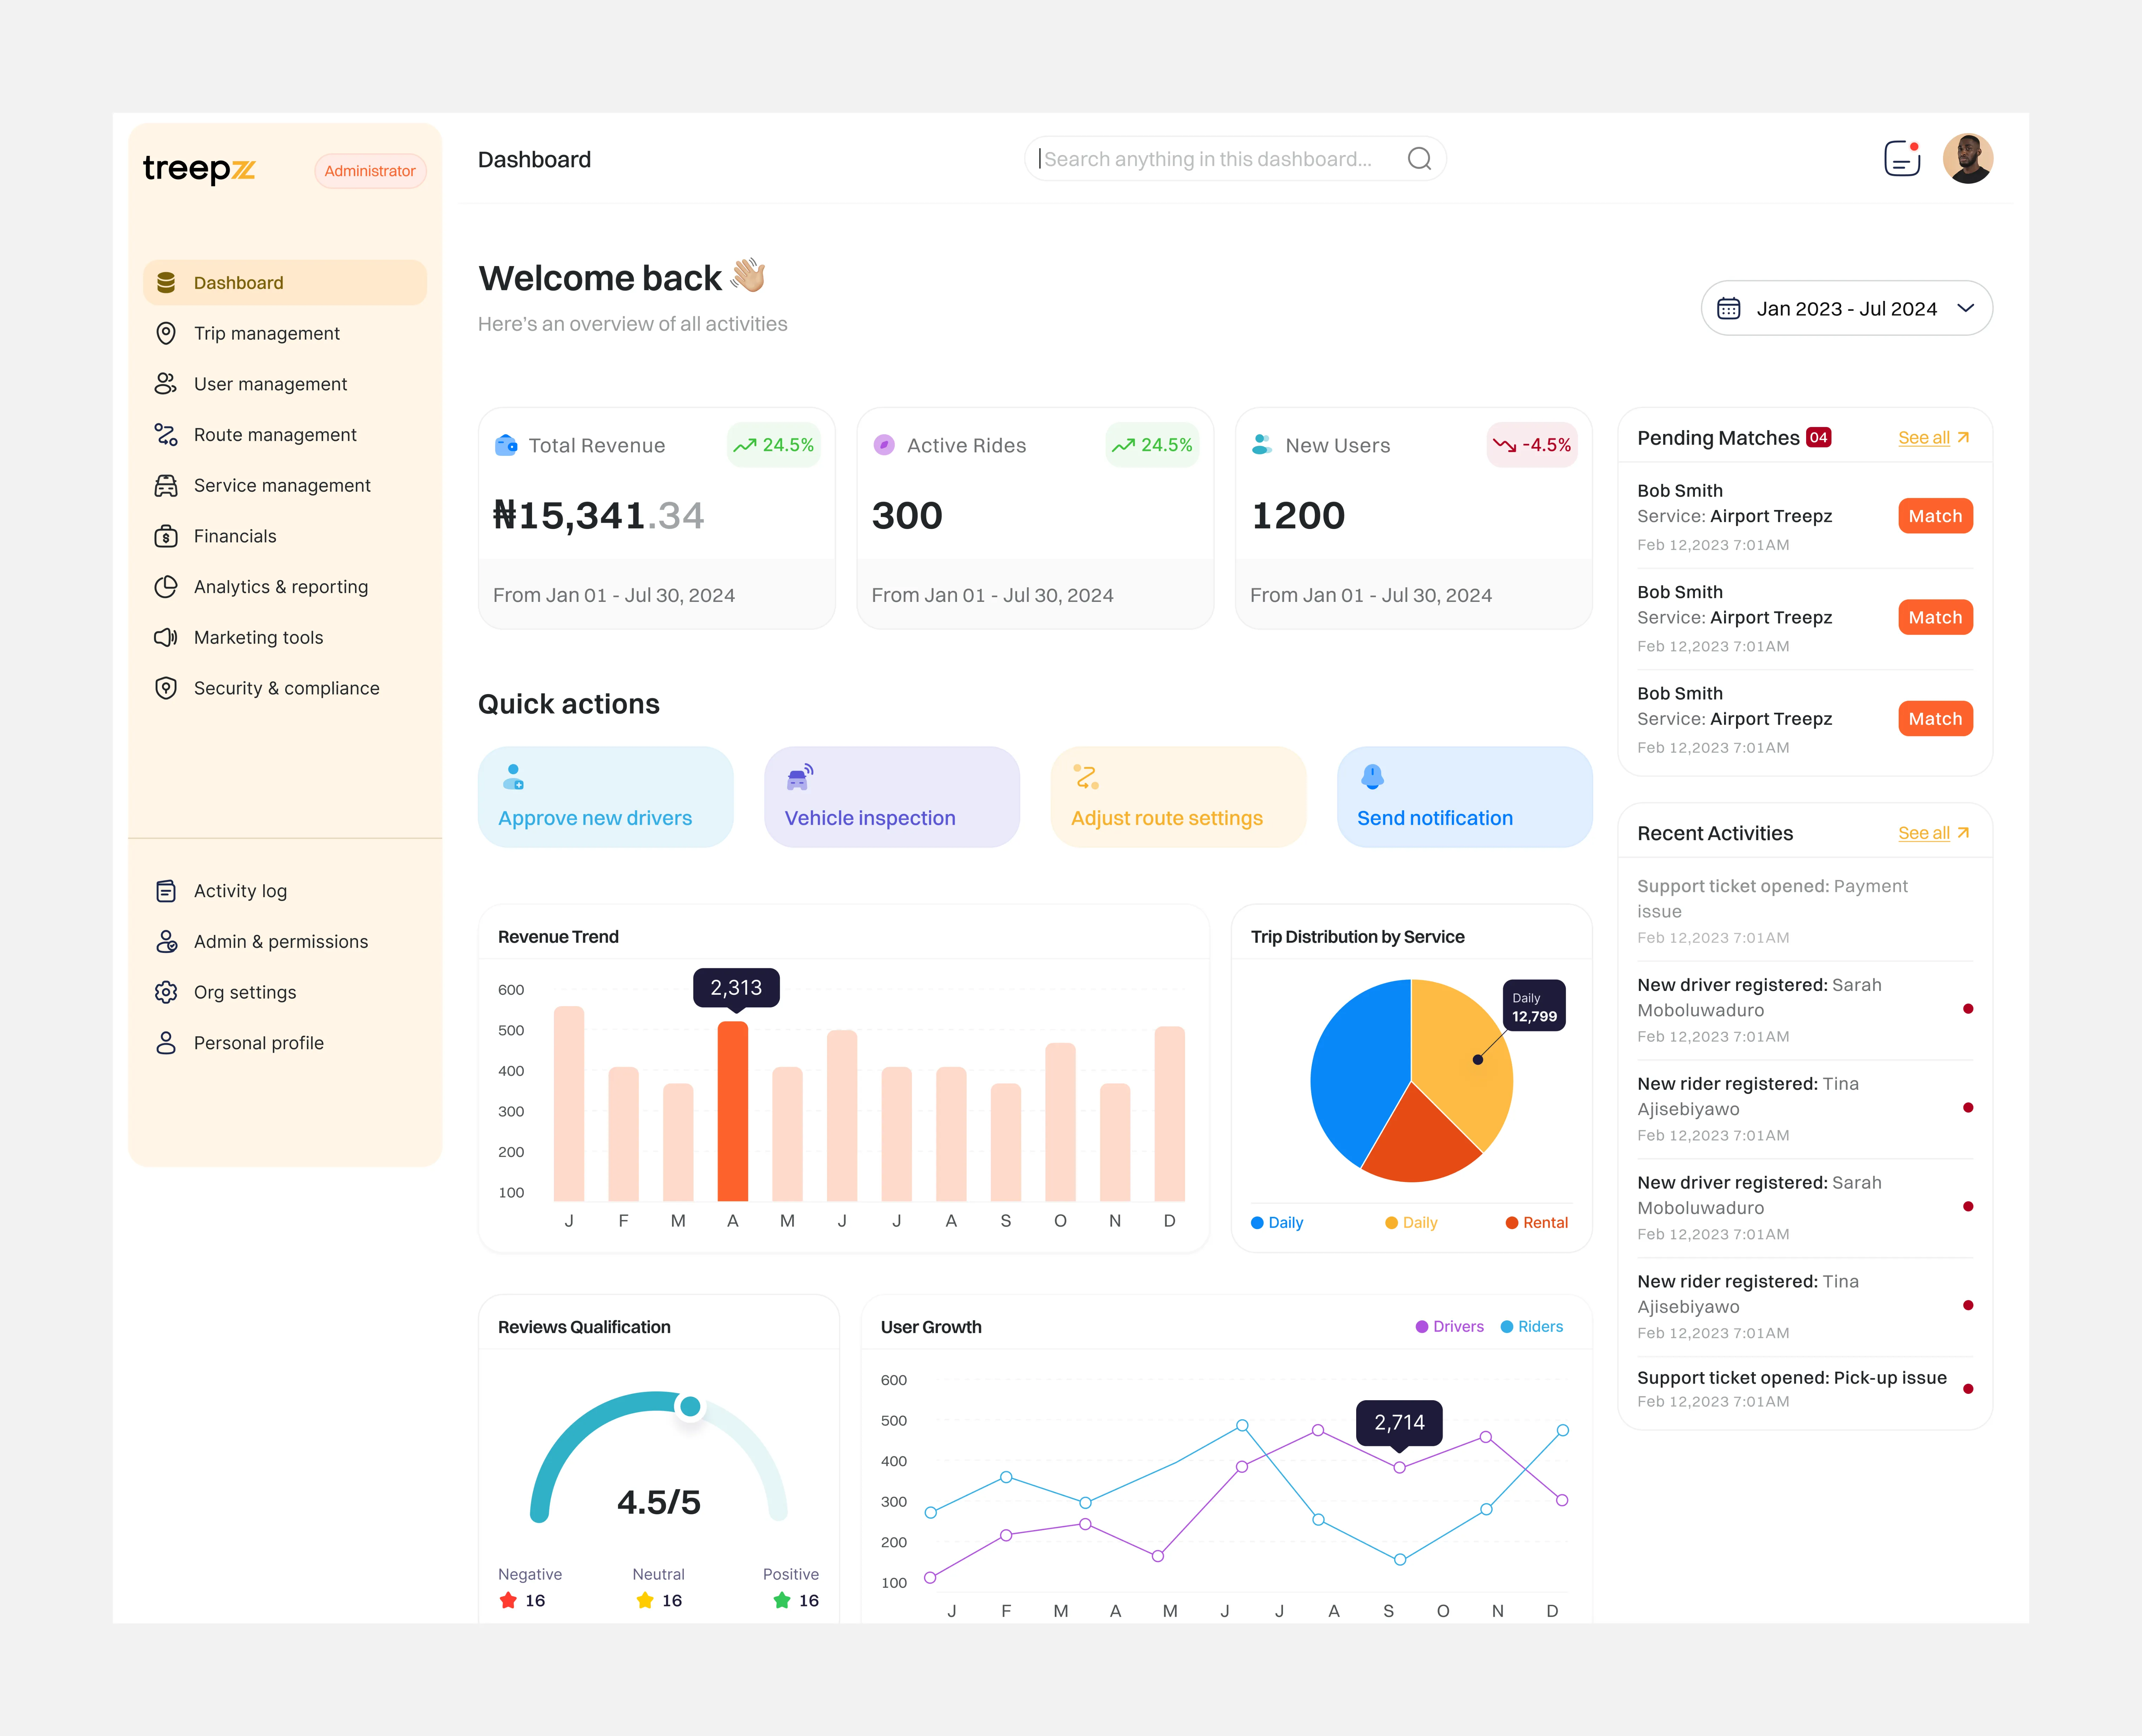
This centralized command center enables our operations team to monitor performance across Nigeria, Ghana, Uganda, and Kenya while making data-driven decisions to optimize the entire transportation network. The real-time metrics and quick actions ensure efficient platform management.
Marketing Support & Visual Design
I collaborated with our marketing team to create compelling Play Store banner graphics that effectively communicate the super-app concept across diverse cultural contexts, extending our design system into promotional materials that highlight region-specific value propositions while maintaining brand consistency and a clear visual hierarchy to guide users through key benefits for both business and consumer audiences.
"Finally, one dashboard for our employee transport and company event vehicle rentals. Our finance team can track everything in one place."
Adebayo Ogundimu, HR Director, Interswitch, Lagos
Monetization Opportunities
Sponsored Ads: Contextual ads at natural break points without impacting the user experience.
Driver Financial Services: Short-term loans and financial products for driver expenses. We couldn't launch our MVP with this.
Outcomes, Analytics, and Key Learnings
To validate our design decisions and track the super-app's performance, I worked with our engineering team to implement a comprehensive analytics setup with custom event tracking across all user touchpoints.
Key metrics we tracked
- Service discovery rates (how users find new features).
- Cross-service adoption patterns.
- Payment method preferences by region.
- Feature usage patterns across different user types.
- Support ticket categories and resolution times.
Analytics framework: Google Analytics 4 with custom events, behavioral tracking, and session recordings across mobile and web platforms
Our dual-mode interface improved task completion by 34%, increased wallet engagement by 3.2x, and reduced onboarding time by 68%. Key findings revealed specific areas for improvement: low-quality vehicle photos in rural areas reduced conversion rates by 23%, and 58% of B2B clients were not aware of our rental services despite using employee transportation regularly.
Team & Credits
| Role | People |
|---|---|
| Product Design Lead | Dára Sobaloju (led strategy, research, and team; oversaw core architecture and design system) |
| Design Team | 2 Product Designers, 1 UX Writer (team I led) |
| Key Partners | Product Management, Engineering, Data Analytics, Marketing |
This case study reflects work completed between January and August 2024 across Treepz's operations in Nigeria, Ghana, Uganda, and Kenya.